


The auto industry is transforming through the rapid electrification of vehicles. However, the transition is not as smooth as it was earlier expected to be. Although Electric Vehicle (EV) sales are growing in the United States, the pace of growth has slowed, supposedly due to a lack of sufficient charging infrastructure and affordable options.
Against this backdrop, EV-maker Lucid Group, Inc. (LCID) delivered less-than-expected vehicles in the third quarter, with quarterly deliveries coming in at 1,457, while analysts polled by FactSet had expected it to deliver about 2,000 vehicles.
In addition, LCID cut its production forecast for fiscal 2023 as demand faltered. The company expects to produce 8,000 to 8,500 vehicles, down from earlier guidance of more than 10,000. Moreover, its third-quarter revenue dropped 29.5% year-over-year to $137.81 million, missing the Wall Street estimate of $177 million.
Given the concerns about subdued vehicle deliveries, let’s look at LCID’s key financial metrics to understand why it could be wise to avoid the stock now.
Tracing LCID's Performance: Exploring Trends of Key Financial Metrics
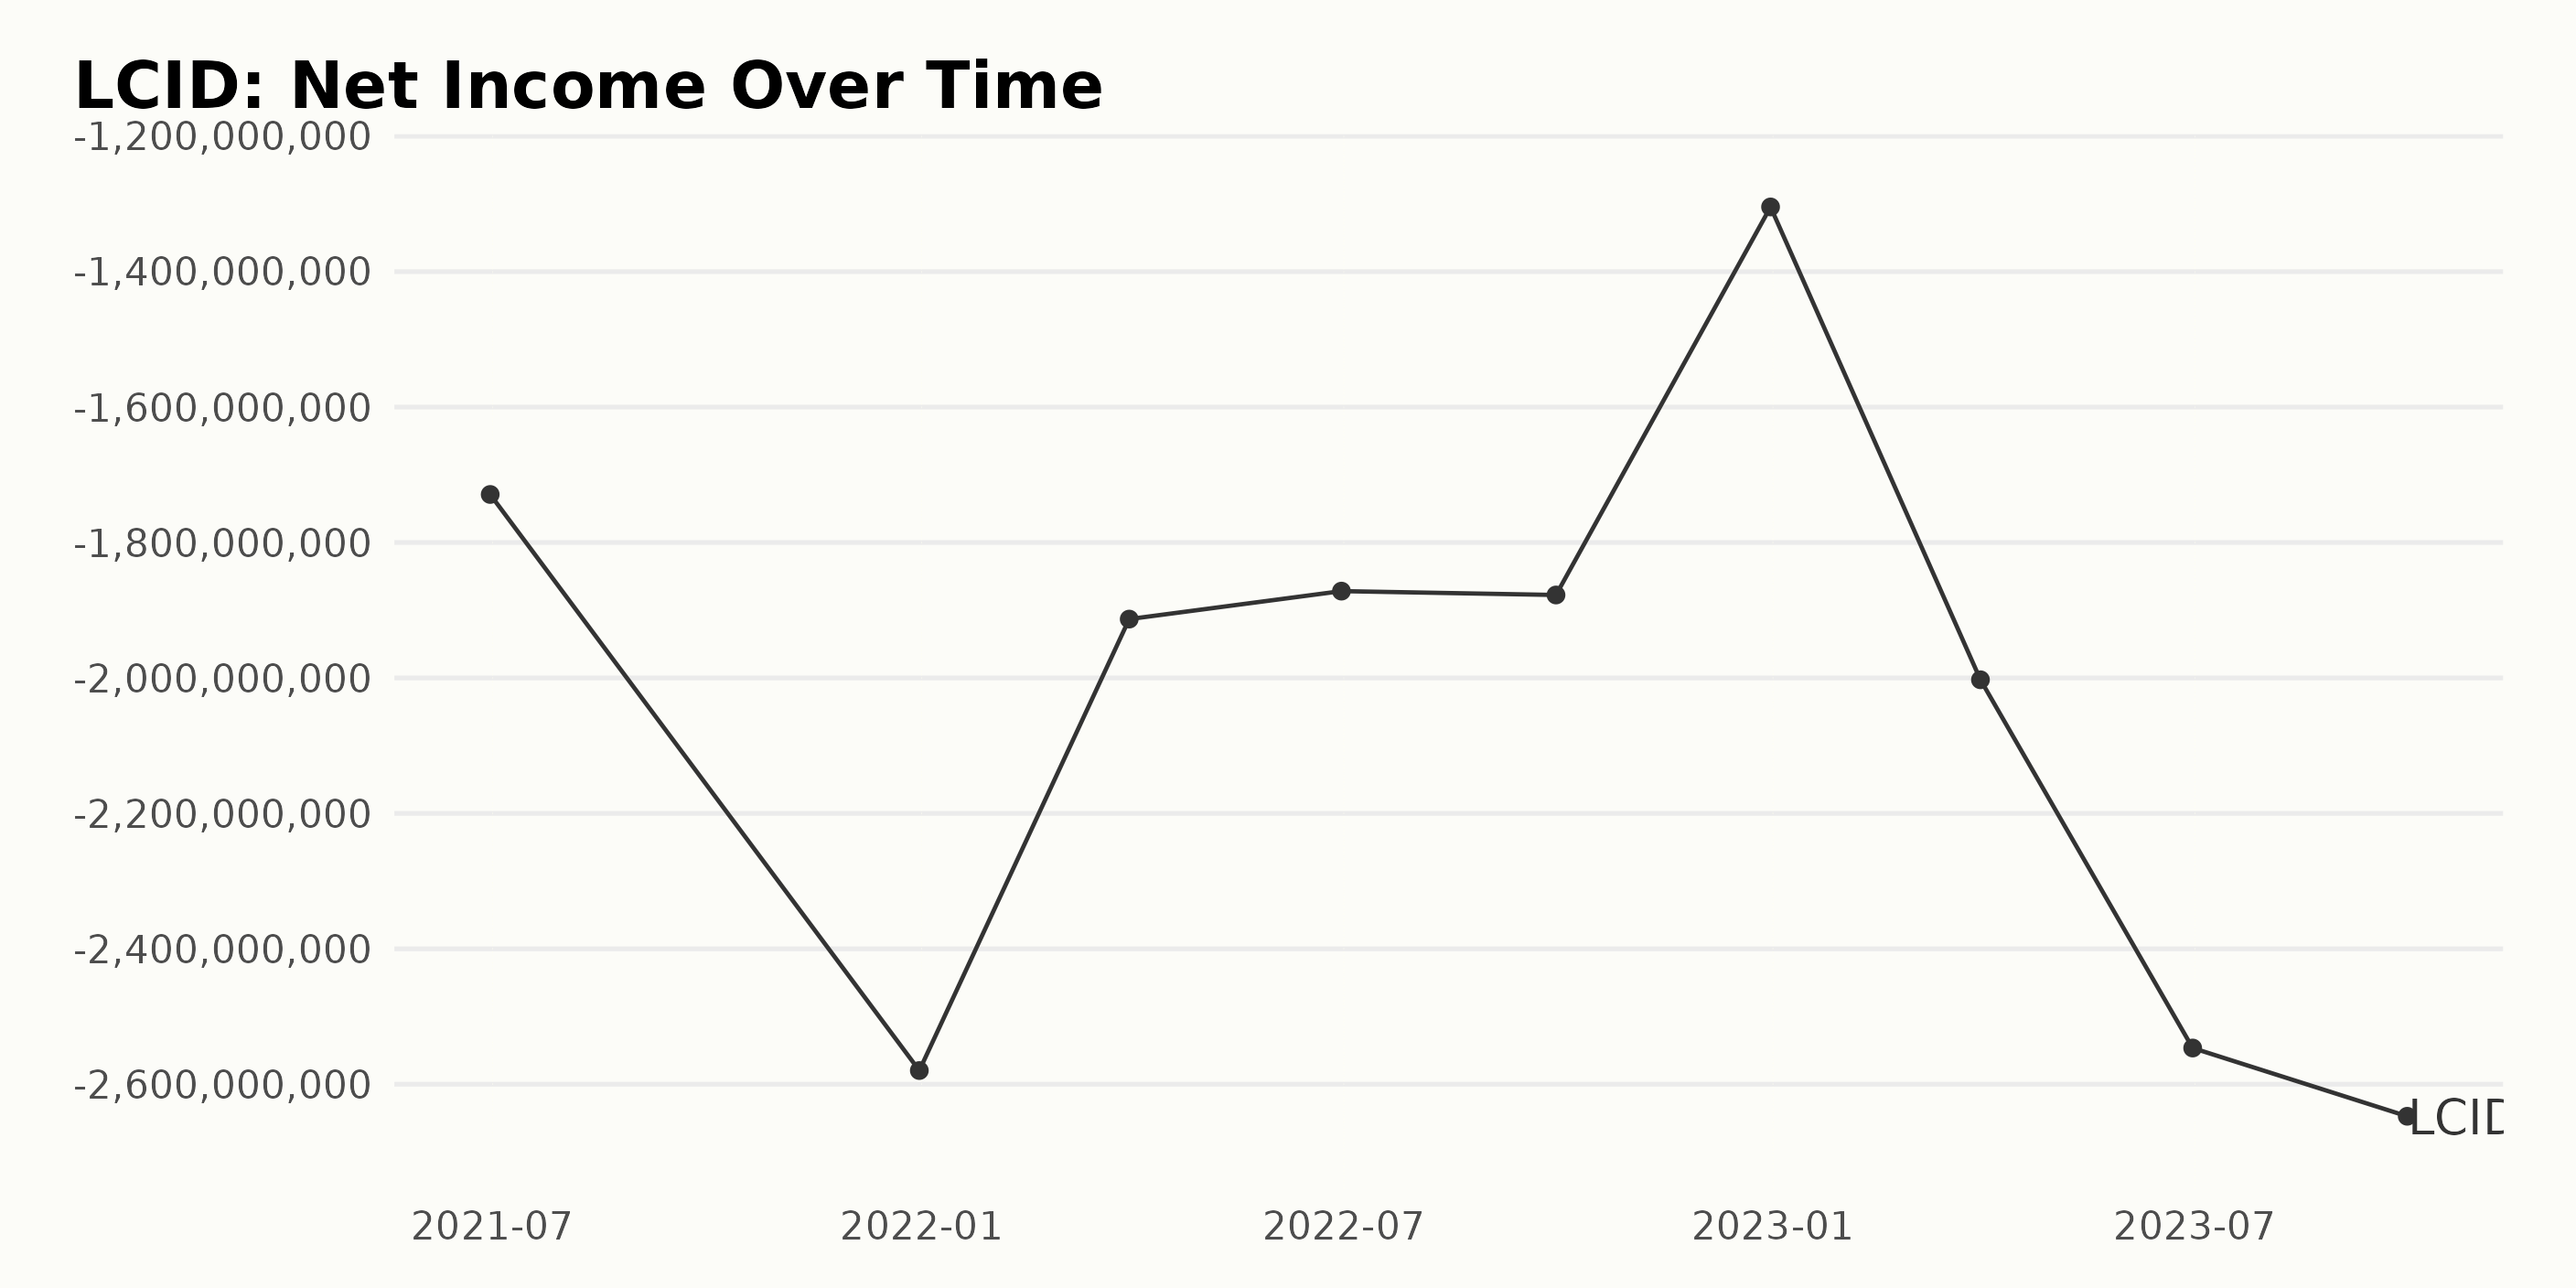
The trend in LCID's trailing-12-month net income over the given time period reflects a fluctuating yet overall negative trajectory. This is evidenced in the data provided below:
- On June 30, 2021, the net income was at a loss of -$1.73 billion.
- By December 31, 2021, the deficit had escalated further to -$2.58 billion.
- In the first quarter of 2022 (March 31), there was a slight decrease in loss, reported at -$1.91 billion.
- However, by the end of the second quarter (June 30, 2022), the net income only marginally improved to -$1.87 billion, with little significant change reported by the third quarter on September 30, 2022, being -$1.88 billion in deficit.
- There was a notable improvement by the end of 2022 (December 31) as the net income loss reached -$1.3 billion.
- The first quarter of 2023, however, saw an increase in the net income loss to -$2 billion (March 31), which worsened further by the end of the second quarter (June 30) to reach -$2.55 billion.
- The highest reported net loss comes in the third quarter (September 30) of 2023 at -$2.65 billion.
This nine-quarter review illustrates that LCID's net loss has experienced fluctuations, but the general trajectory has been toward increasing losses rather than gains. Negative growth can also be observed from the initial net loss of -$1.73 billion in June 2021, increasing to a larger deficit of -$2.65 billion in September 2023.
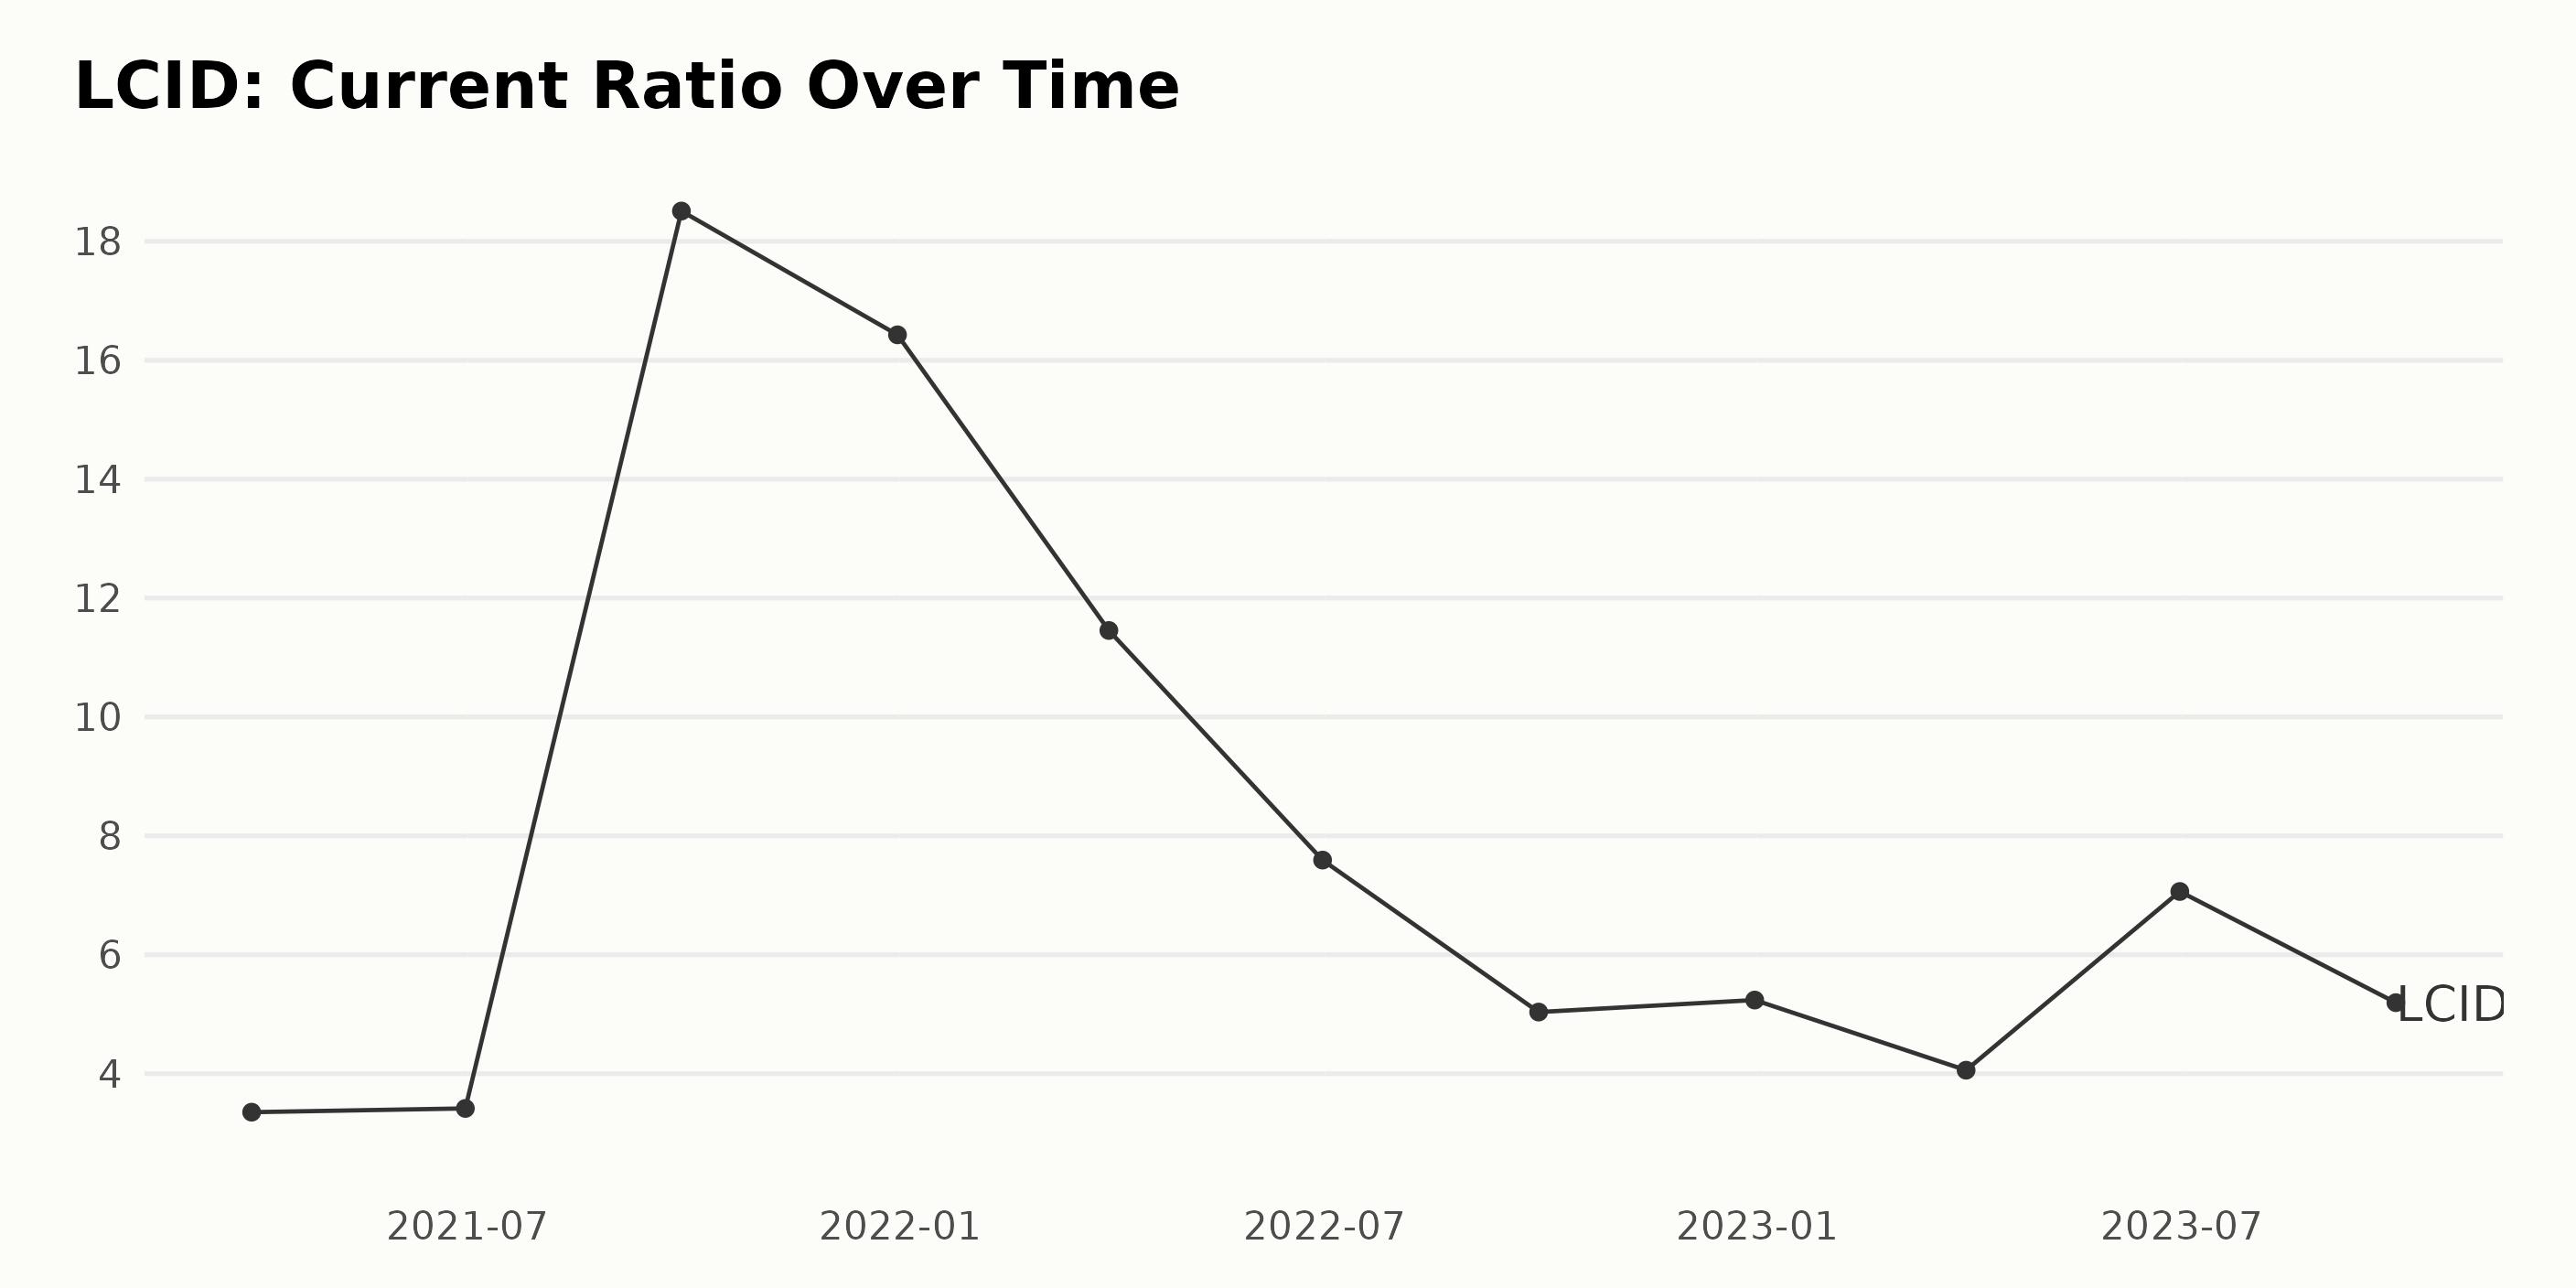
The following is a summary of fluctuations and trends within the current ratio of LCID.
- On March 31, 2021, LCID started with a current ratio of 3.35.
- Skills a slight increase in the current ratio to 3.42 by June 30, 2021.
- Consequently, on September 30, 2021, a dramatic surge occurred to an impressive ratio of 18.51, the highest in this series.
- This uptrend was not sustained as LCID reported constantly decreases in subsequent quarters to 16.43, 11.46, 7.59, and 5.04, respectively, from December 2021 through September 2022.
- There was a minimal upward inflection in December 2022, where the current ratio slightly increased to 5.24.
- The first quarter of 2023 showed a declining trend to 4.06, but surprisingly, the ratio shot up to 7.07 in June 2023.
- However, the current ratio saw another decline by the end of September 2023, falling to 5.20. Overall, there is a significant decrease in the current ratio of LCID between March 31, 2021, and September 30, 2023.
Comparing the last value to the first to calculate the growth rate reveals a 54.98% decrease. This shows a trend toward decreasing liquidity over the specified time frame, increasing emphasis on the more recent data, and the last value shows an unstable liquidity condition for LCID.
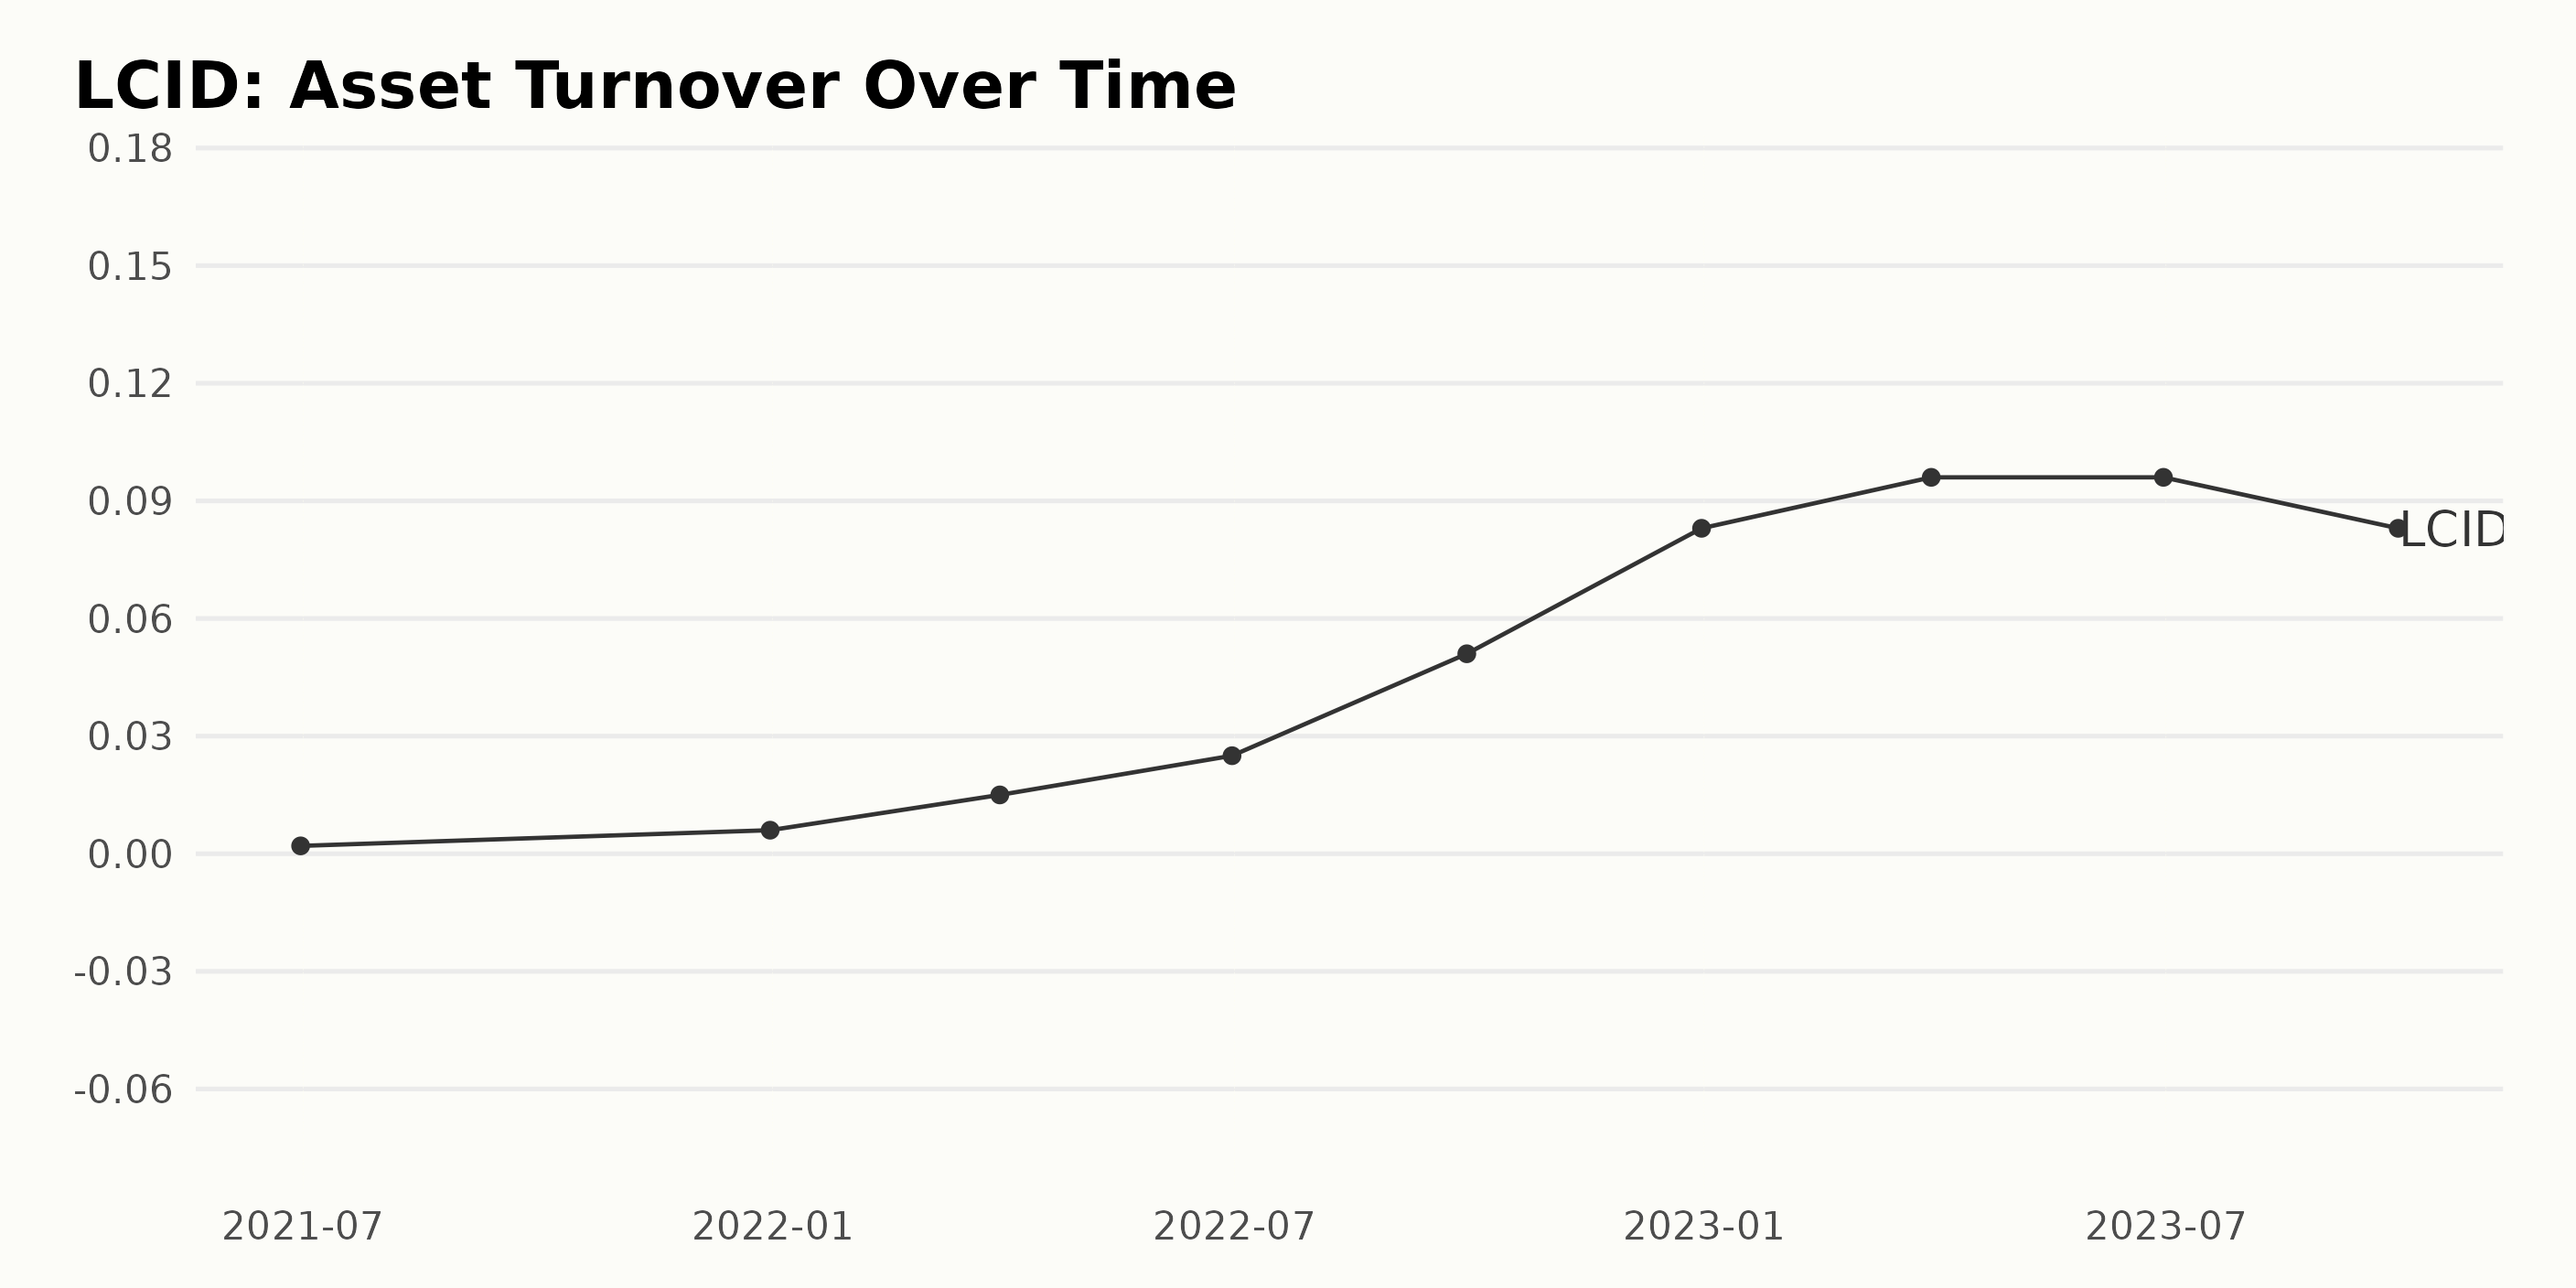
The trend and fluctuations of asset turnover for LCID span from June 2021 to September 2023. Within the series, there is a discernible trend showcasing growth in asset turnover over this period.
- June 30, 2021: The series begins with the asset turnover being at a relatively low 0.002.
- December 31, 2021: As we progress to the end of the year, we see some growth in the asset turnover figure, which stands at 0.006, marking an increase of approximately 200% within six months.
- June 30, 2022: By the mid-year of 2022, LCID's asset turnover had significantly grown to 0.025, marking more than a 100% increase from the figure at the start of the year.
- September 30, 2022: There was a substantial rise by the third quarter of 2022 as the figure surged to 0.051.
- December 31, 2022: Festivities seem to have brought blessings to LCID, as by the close of the year 2022, the asset turnover increased to 0.083.
- March 31, 2023 - June 30, 2023: The first half of 2023 showed little fluctuation, with asset turnover sustaining at 0.096.
- September 30, 2023: Towards the end of 2023, we see a slight dip in the asset turnover that decreased to 0.083.
From June 2021 to September 2023, the latest value from the series was recorded on September 30, 2023, which is 0.083, and the first value was on June 30, 2021, which is 0.002.
Overall, while spotting some fluctuations throughout, the trend generally depicts an increasing trajectory with greater emphasis on more recent figures showing higher values in asset turnover for LCID until mid-2023, followed by a decrease as the series closes.
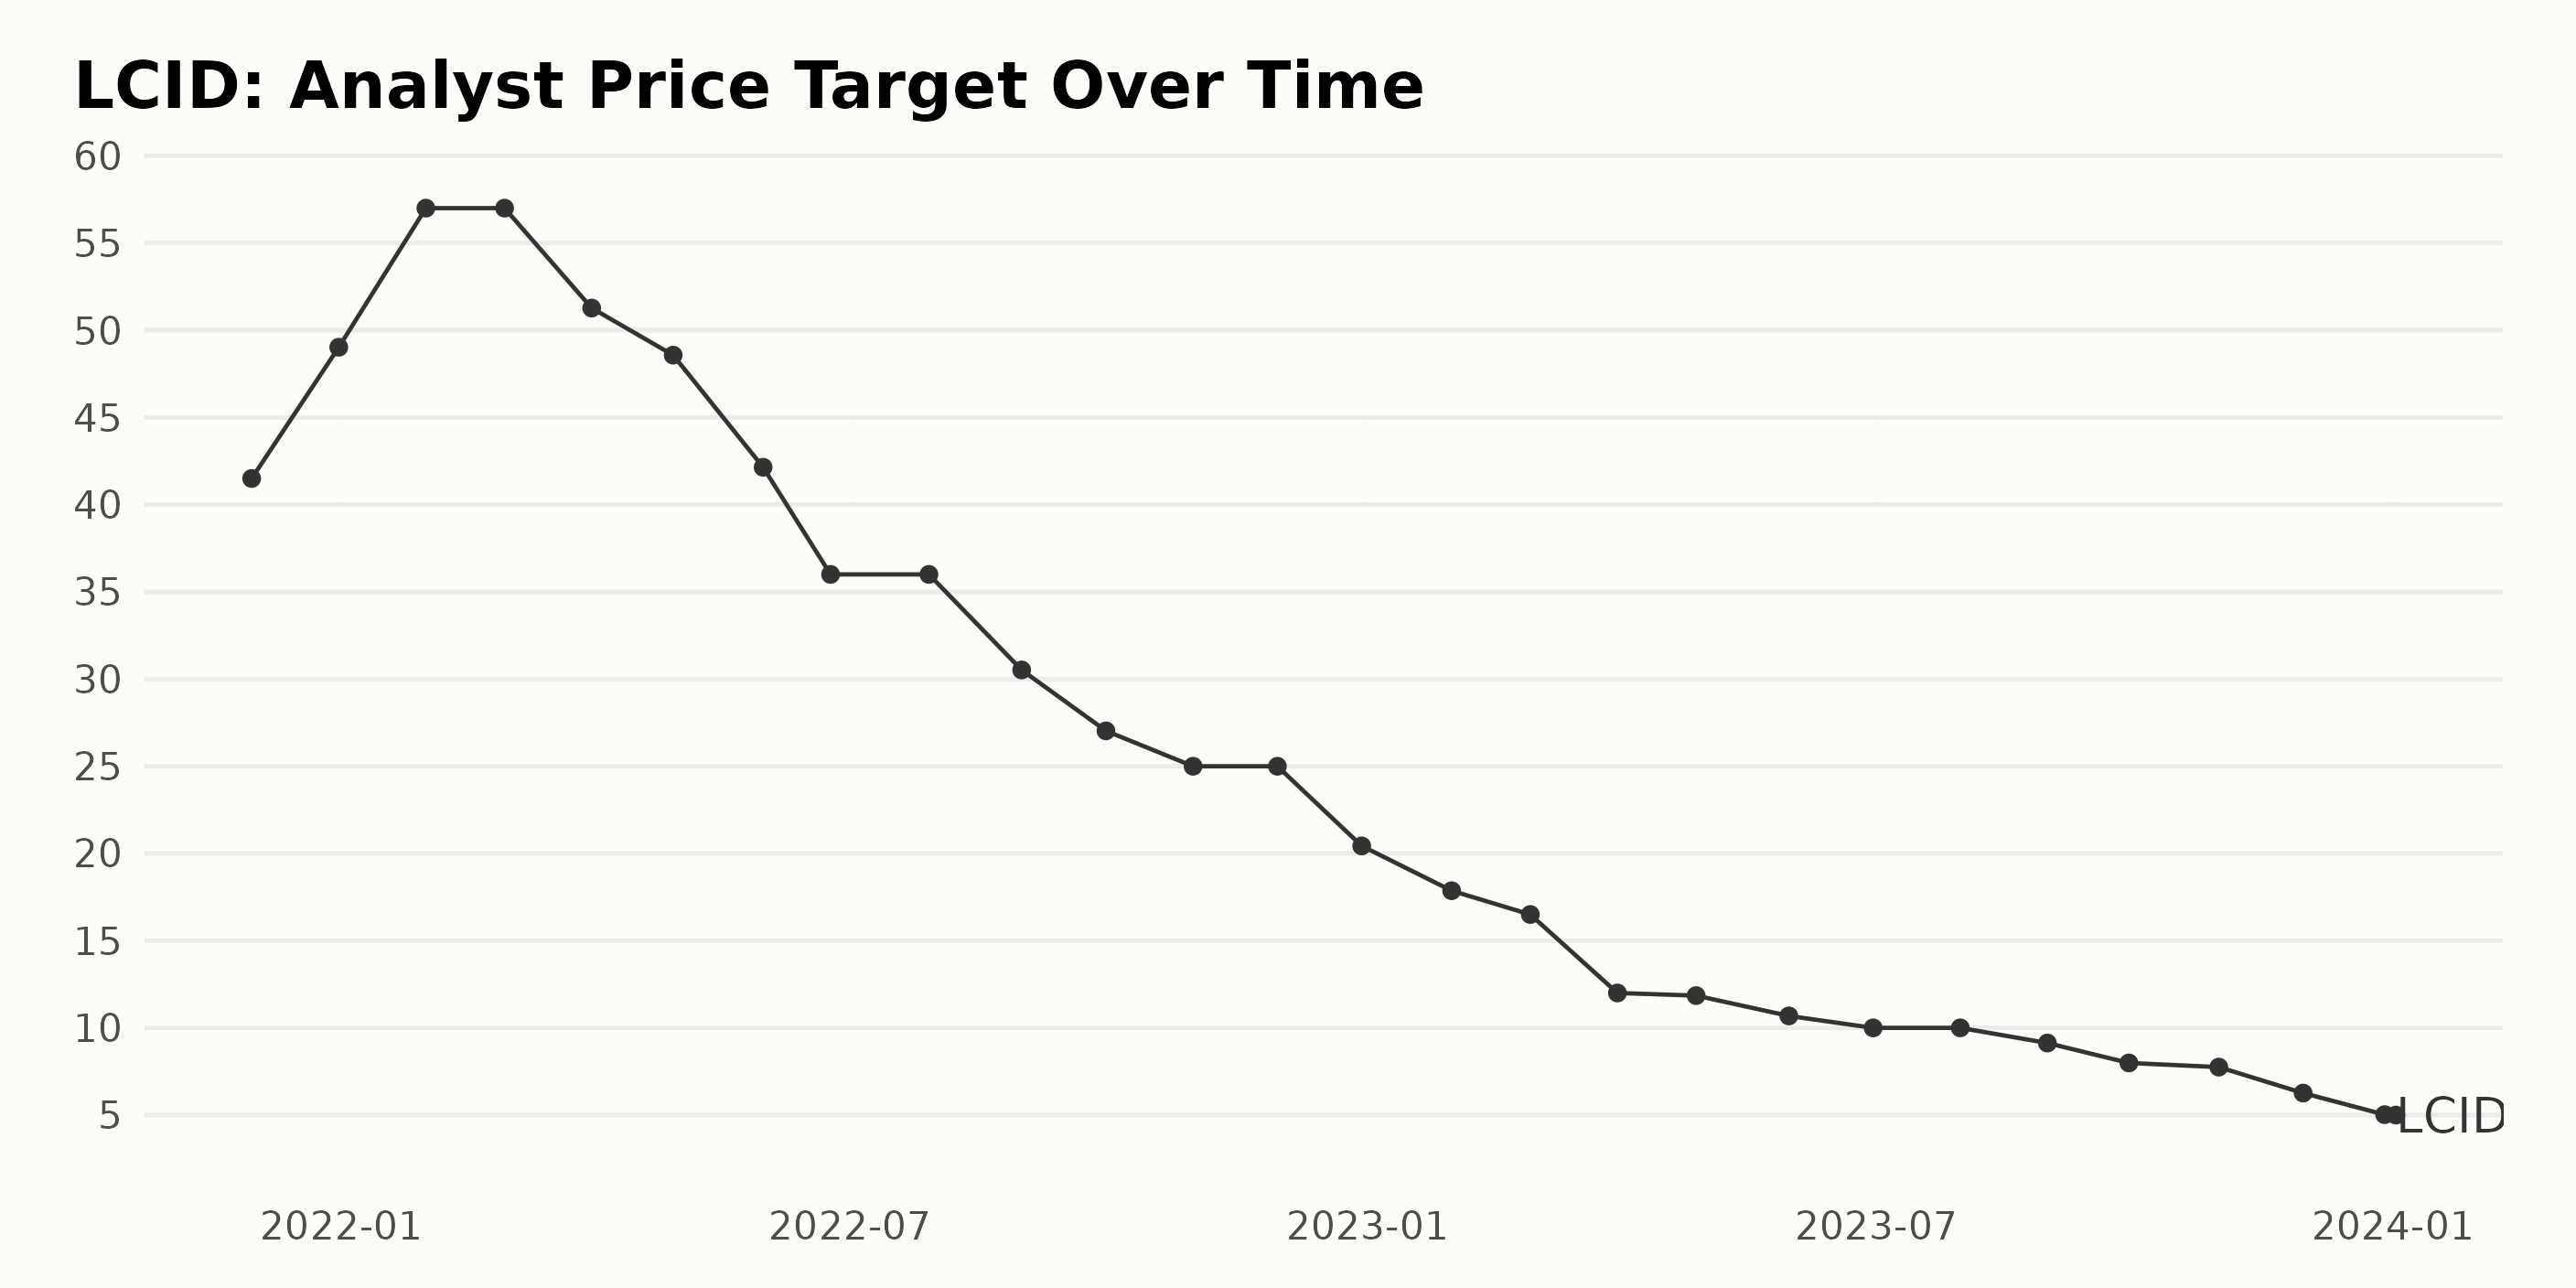
The trend in the analyst price target for LCID reveals a generally downward progression over the three-year period from November 2021 to January 2024. Over this time frame, the target underwent several fluctuations.
- In November 2021, the analyst price target was valued at $41.5 and showed an upward trend until February 2022, when it remained steady at $57.
- Beginning in March 2022, the pattern started to deteriorate, reaching a slight dip with a value of $51.27.
- This downtrend continued, gradually falling to $36 in June and July 2022 before dropping sharply to $30.52 in August 2022.
- Post-August 2022, the analyst price target experienced another drop, decreasing progressively month by month to a value of $25 in November.
- This decline persisted through 2023, with the value hitting a low of $12 in March, picking up slightly to reach $11.85 in April before falling again to just $10 in June and July.
- From August 2023, the trend took another nosedive, bottoming out with a value of $5.03 in December, with a very slight increase to $5 in January 2024.
To summarize, the analyst price target for LCID has fallen from $41.5 in November 2021 to $5 in January 2024, marking a significant decrease over this period. The calculated growth rate shows a negative trend, indicating that the price target declined by approximately 88% over this period.
It's noteworthy to point out that noticeable drops are seen post-February 2022 and August 2023, with the value remaining consistently below $15 throughout 2023 and into 2024. The most recent data suggests a continuing negative growth rate, with the analyst price target standing at $5 in January 2024.
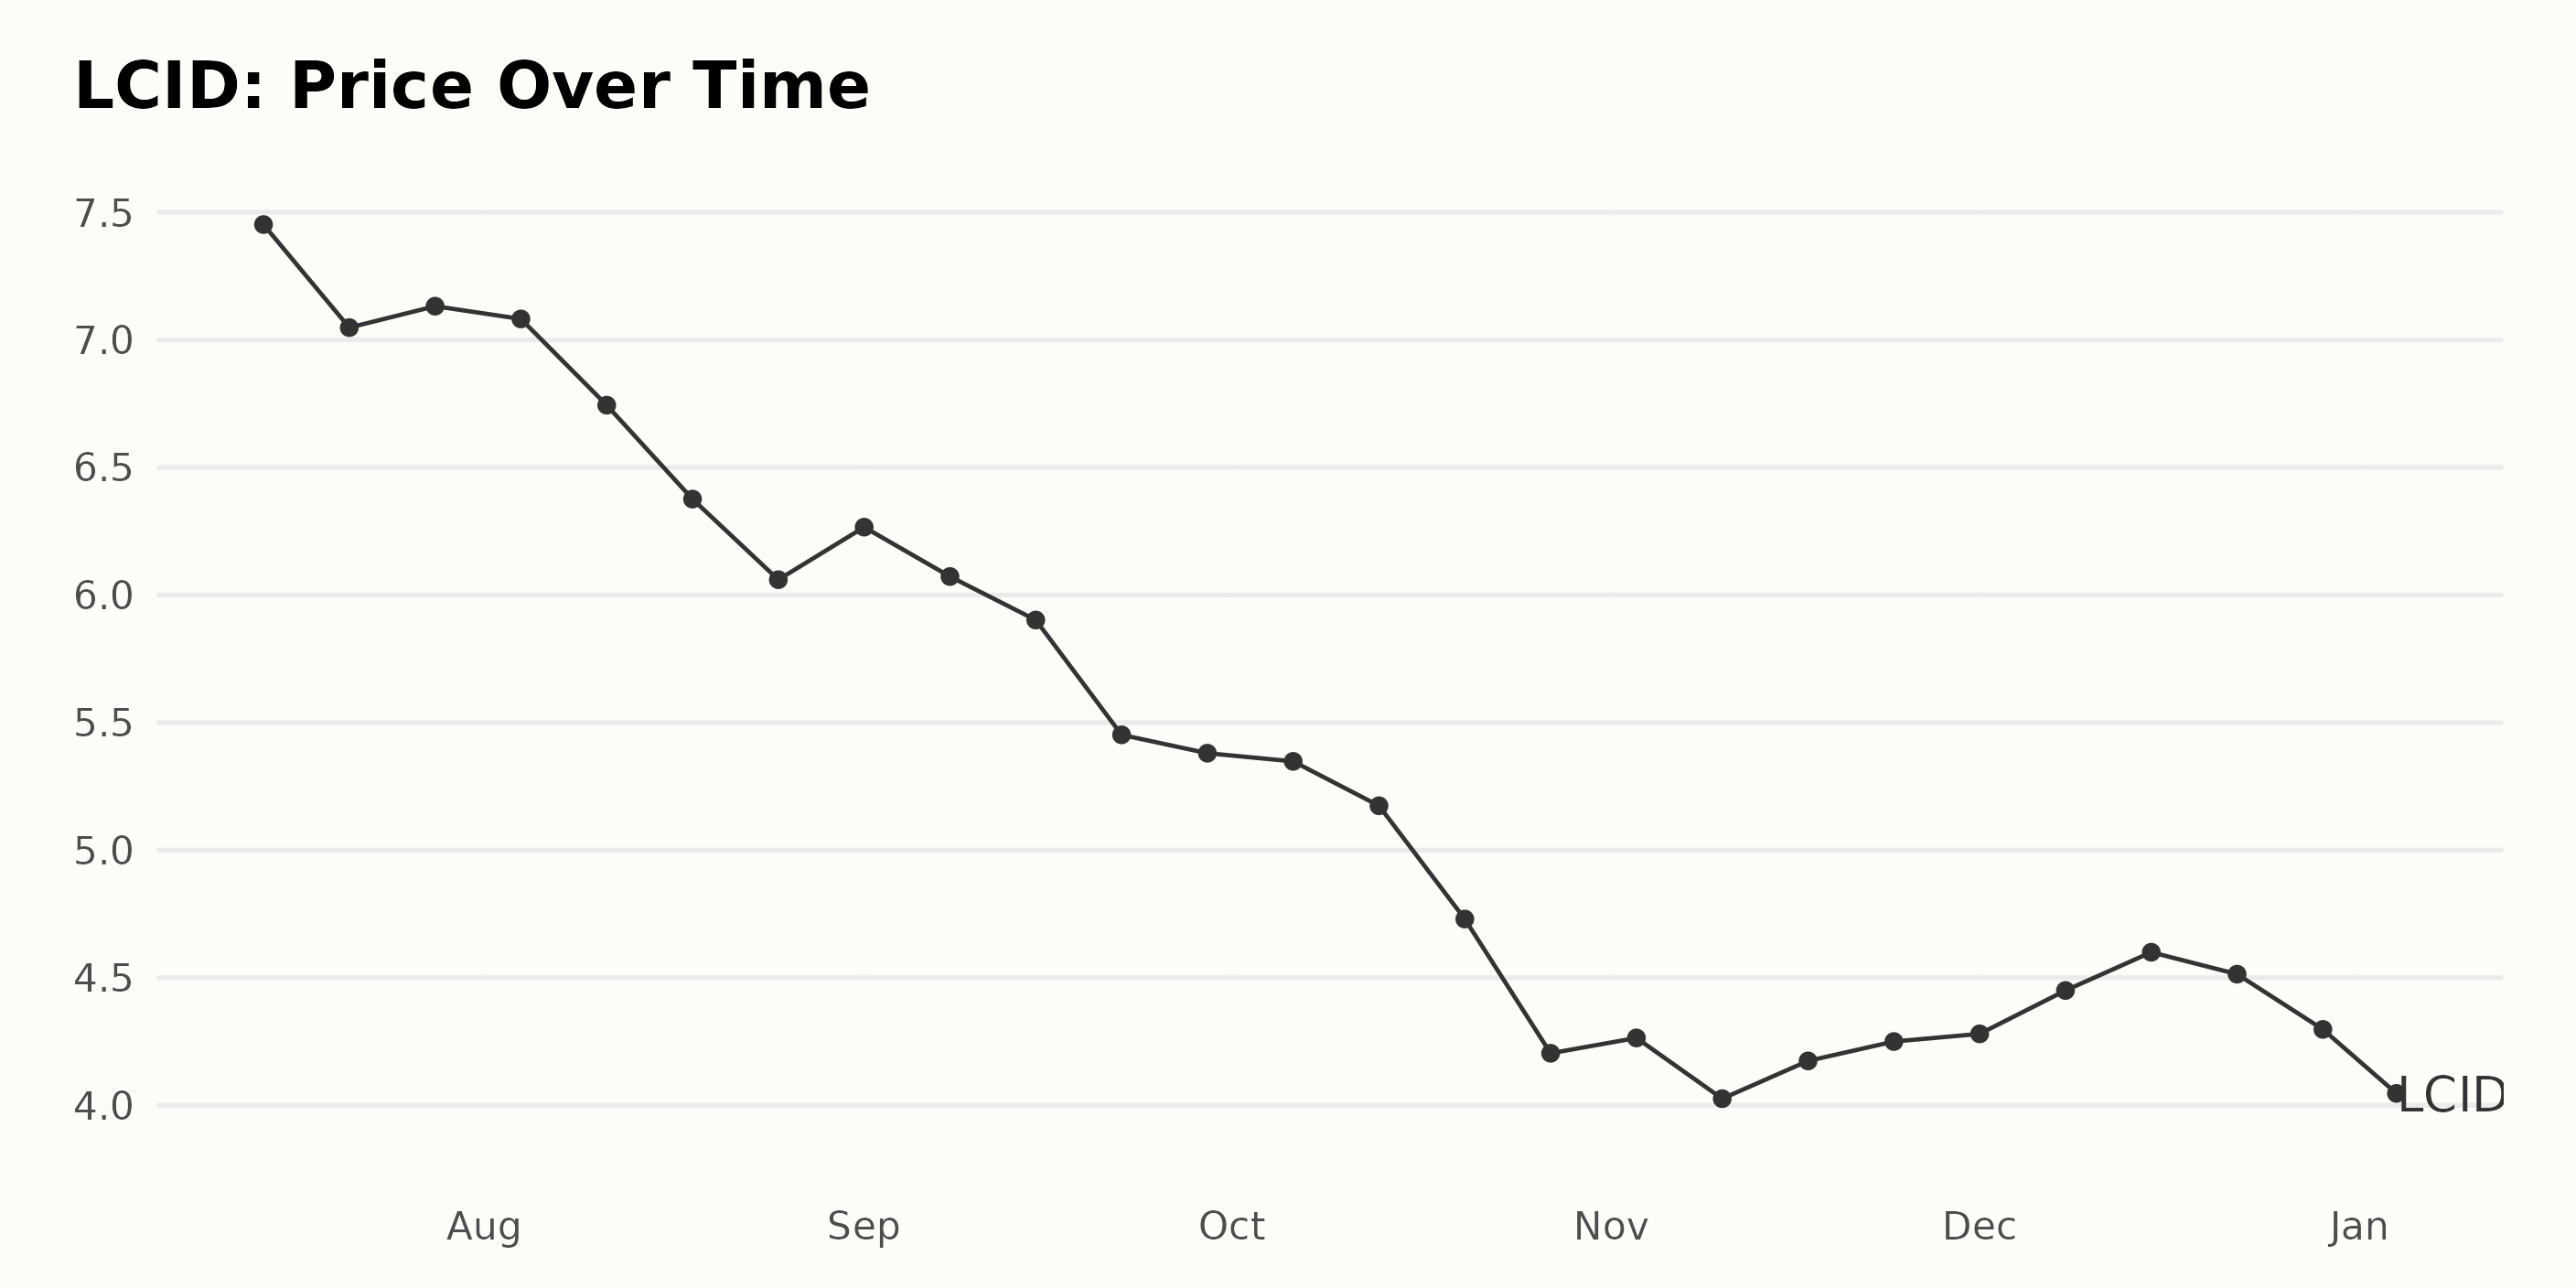
Exploring LCID's Downward Share Price Trend: A Six-Month Analysis (July 2023-January 2024)
Looking at the data for the share price of LCID, a clear and accelerating downward trend can be observed in the period from July 2023 to January 2024. Here are some key points:
- On July 14, 2023, the price was at its peak with a value of $7.45.
- By the end of that same month (July 28, 2023), it decreased slightly to $7.13.
- A noteworthy drop was seen by the end of August 2023, when it reached $6.06, showing a steady decrease throughout the month.
- In September, there was a slight rise on September 1, 2023, with the price going up to $6.27, but this was quickly reversed, and by the end of the month (September 29, 2023), it had dropped to $5.38.
- October followed the same trend, starting at $5.35 on October 6, 2023, and ending with a significantly lower value of $4.20 on October 27, 2023.
- In November 2023, it seems to stabilize around values of about $4.2.
- This stabilization roughly continued into December 2023, with slight fluctuations between $4.28 and $4.60 before dipping towards the year's end to $4.29 on December 29, 2023.
- The new year started with the lowest value of $3.89, recorded on January 4, 2024.
Overall, it appears that the trend for LCID's share price is progressively decreasing over the mentioned period. There are some moments of slight recovery, but these are ultimately part of a larger descending pattern. The decline seems to decelerate somewhat toward the end of the period in question, but no significant upward trend reversal is evident. Here is a chart of LCID's price over the past 180 days.
Analyzing LCID's Performance: Momentum, Growth, and Sentiment Trends in POWR Ratings
LCID, which is in the Auto & Vehicle Manufacturers category of stocks with a total of 52 stocks, has had a consistent POWR Ratings Grade value. The data shows the following:
- On July 15, 2023, its POWR Grade was F (Strong Sell).
- The grade remained F (Strong Sell) consistently through August 26, 2023.
- LCID's rank improved significantly on September 9, 2023, achieving 34th place, despite maintaining the same F (Strong Sell) POWR Grade.
- In some weeks that followed, LCID was not ranked but kept the same F (Strong Sell) grade.
- A notable improvement occurred on October 21, 2023, when it was ranked 10th, though still holding an F (Strong Sell) grade.
- However, by October 28, the grade remained F (Strong Sell).
- After fluctuating throughout November and most of December 2023, the company saw some improvement in ranking by the end of the year, reaching 41st place on December 2.
- Despite an improvement to 10th place in the category on December 9, 2023, LCID succumbed to a decline, concluding the year at 52nd rank, last in the sector, as of December 30, 2023.
- As of the latest data point on January 5, 2024, LCID's POWR Grade remains F (Strong Sell), and its rank within its category continues to be #52 - last in the category.
In summary, throughout this period, LCID has maintained a constant POWR Grade of F (Strong Sell), indicating quite poor performance. Its rank has fluctuated significantly within its category, even dropping to the last position on several occasions.
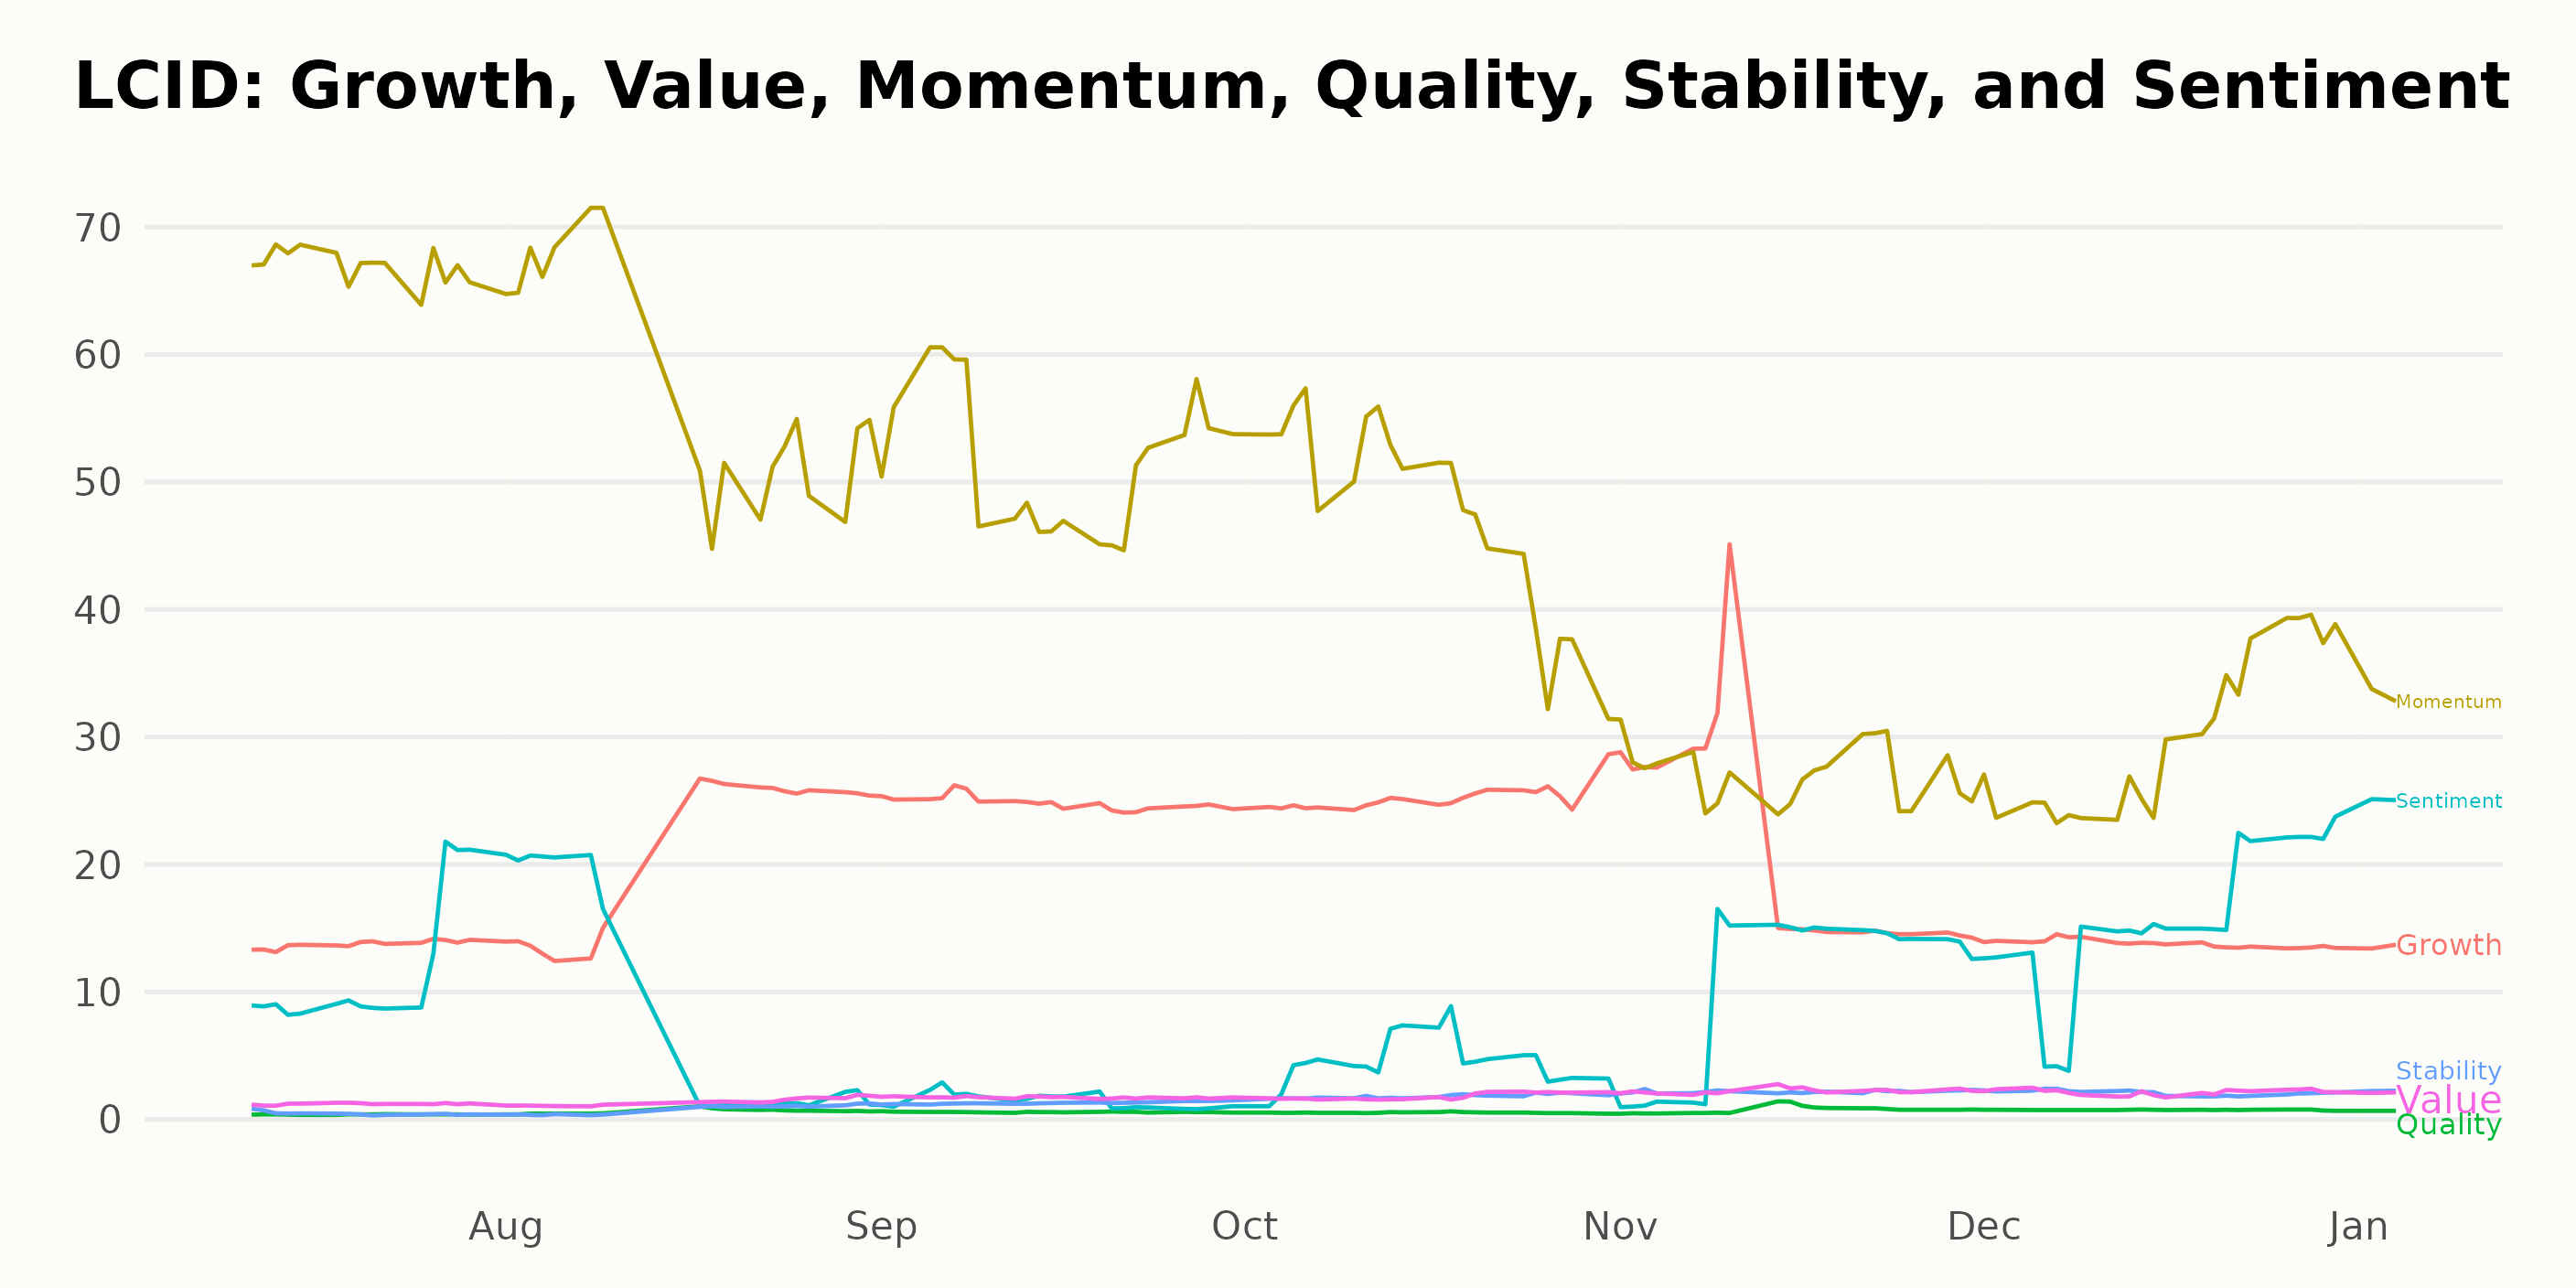
The POWR Ratings for LCID along certain dimensions indicate interesting trends and substantial scores. Focusing on the most noteworthy dimensions, it is observed that Momentum, Growth, and Sentiment emerge over other dimensions:
Momentum - Momentum presents the highest rating overall, especially when compared with the other dimensions. At its peak in July 2023, the Momentum score reached 67. However, a clear downward trend was noted from July to November 2023, dropping from 67 to 27. This indicates a significant decrease in momentum over these months.
Growth - The Growth dimension witnessed a rise between July 2023 and September 2023, going up from 14 to a maximum value of 25. September and October both recorded a top score of 25, signifying a strong period of growth for LCID during those months. Afterward, it experienced a slow decline, reaching back to 14 by December 2023, and remained constant at 14 at the beginning of January 2024.
Sentiment - Sentiment fluctuated over time but showed an enhancement at certain intervals. Starting from 12 in July 2023, the score dropped to just one by September 2023. Notably, there was a considerable improvement from November 2023, when Sentiment rose from 11 to 25 by January 2024, indicating a renewed positive sentiment toward LCID.
While these POWR Ratings offer valuable insights, they should be interpreted in conjunction with other information and market conditions to conclude a comprehensive understanding of LCID's performance.
How does Lucid Group, Inc. (LCID) Stack Up Against its Peers?
Other stocks in the Auto & Vehicle Manufacturers sector that may be worth considering are Mercedes-Benz Group AG (MBGAF), REV Group, Inc. (REVG), and Isuzu Motors Limited (ISUZY) - they have better POWR Ratings. Click here to explore more Auto & Vehicle Manufacturers stocks.
What To Do Next?
Get your hands on this special report with 3 low priced companies with tremendous upside potential even in today’s volatile markets:
3 Stocks to DOUBLE This Year >
LCID shares were trading at $3.86 per share on Friday morning, down $0.03 (-0.77%). Year-to-date, LCID has declined -8.31%, versus a -1.27% rise in the benchmark S&P 500 index during the same period.
About the Author: Anushka Dutta

Anushka is an analyst whose interest in understanding the impact of broader economic changes on financial markets motivated her to pursue a career in investment research.
The post Is Lucid Group (LCID) a Hidden Gem or a Risky Bet in the Auto Industry? appeared first on StockNews.com