


Global-e Online Ltd. (GLBE), headquartered in Petah Tikva, Israel, enables cross-border direct-to-consumer e-commerce through its platform. Its end-to-end solutions help retailers and brands increase international traffic conversion and sales and achieve online growth.
The company declared its third-quarter results last week, reporting topline growth and narrowing losses. However, GLBE also lowered its fiscal 2023 topline outlook. The company earlier expected its revenue to come in between $570 million and $596 million, while it now expects fiscal 2023 revenue between $563 million and $571 million.
Moreover, GLBE’s stretched valuation is concerning. In terms of its forward EV/Sales, it is trading at 8.85x, 670.5% higher than the industry average of 1.15. Additionally, its forward Price/Sales multiple of 9.26 is considerably higher than the industry average of 0.84.
Given this scenario, let’s look at the trends of GLBE’s key financial metrics to deduce why it could be prudent to steer clear of the stock now.
Analyzing GLBE's Major Financial Shifts: Upswings and Downturns (2020-2023)
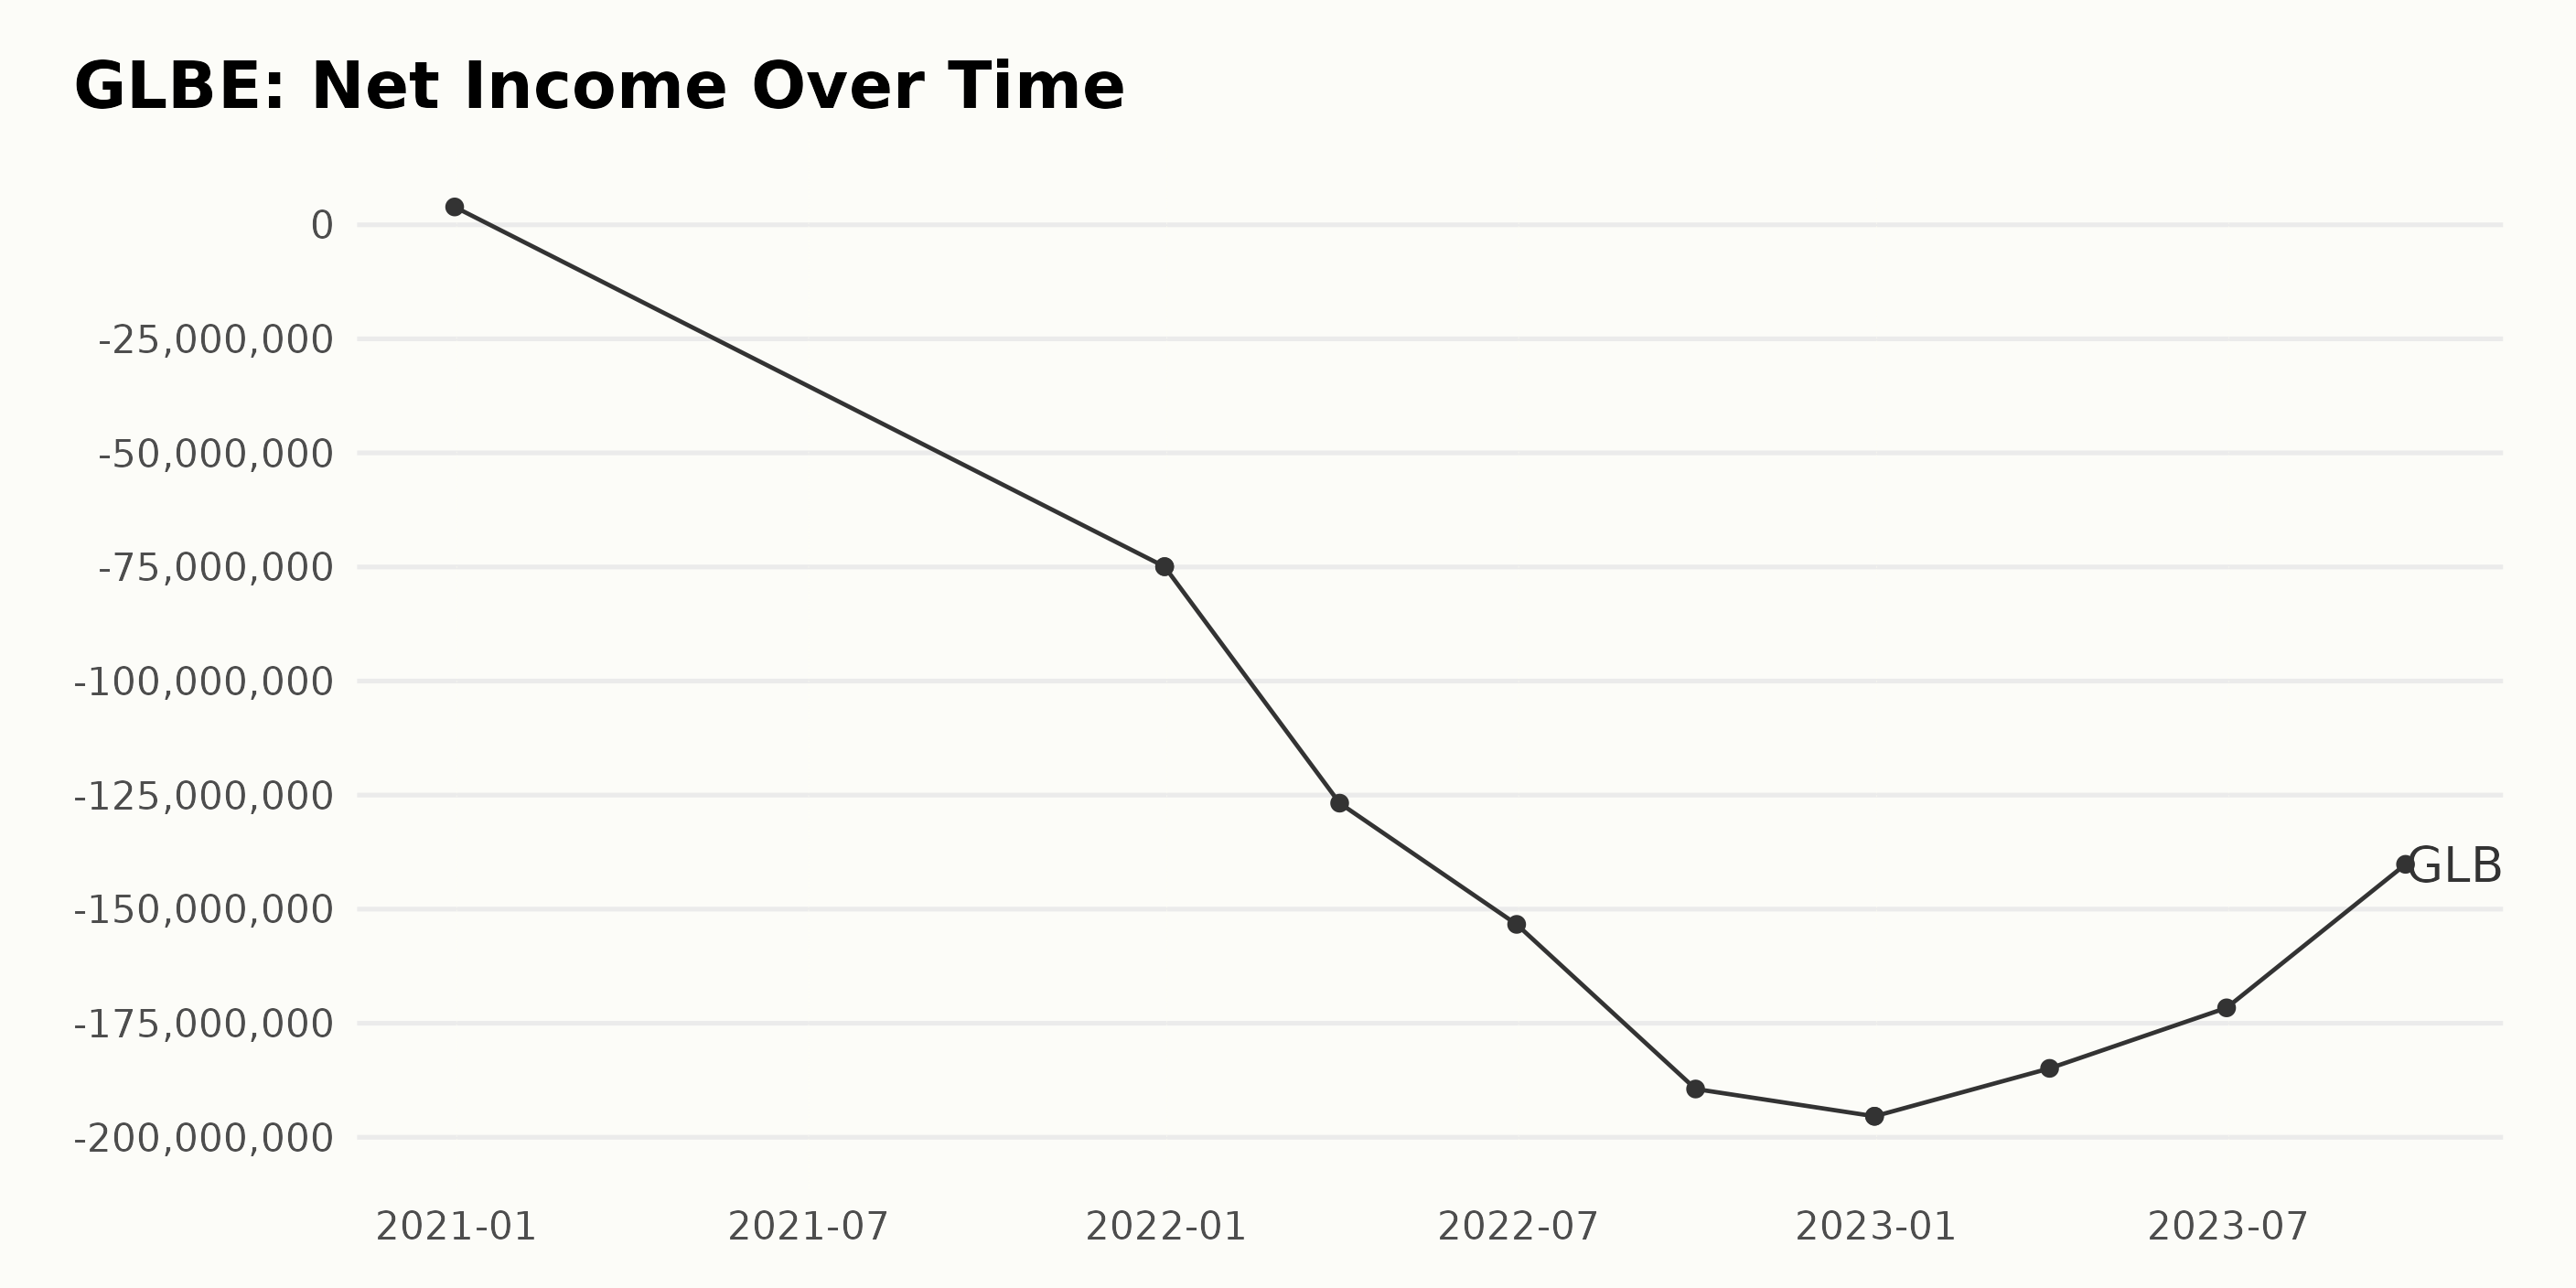
The trailing-12-month net income of GLBE has seen significant fluctuations over the last few years. Here's a snapshot:
- On December 31, 2020, the net income reported was $3.91 million.
- However, a year later on December 31, 2021, it drastically dipped to -$74.93 million.
- This downward trend continued into 2022. With -$126.77 million on March 31, -$153.34 million on June 30, and -$189.42 million on September 30.
- By the end of 2022 (December 31), the net income fell even further to -$195.40 million.
- The first quarter of 2023 saw some recovery at -$184.90 million on March 31.
- There was a moderate increase in the second quarter of 2023 (June 30), showing a net income of -$171.63 million.
- Significant improvement was seen in the third quarter of 2023 when the net income was valued at -$140.18 million.
By calculating the difference between the first value recorded on December 31, 2020, and the last recorded value on September 30, 2023, which indicates a reduction of $143.27M over this period, we can conclude that GLBE's net income has decreased significantly during these years.
This heavy decline suggests financial instability within the company during this period. However, improvements in numbers towards 2023 could also indicate a positive trajectory as we move forward.
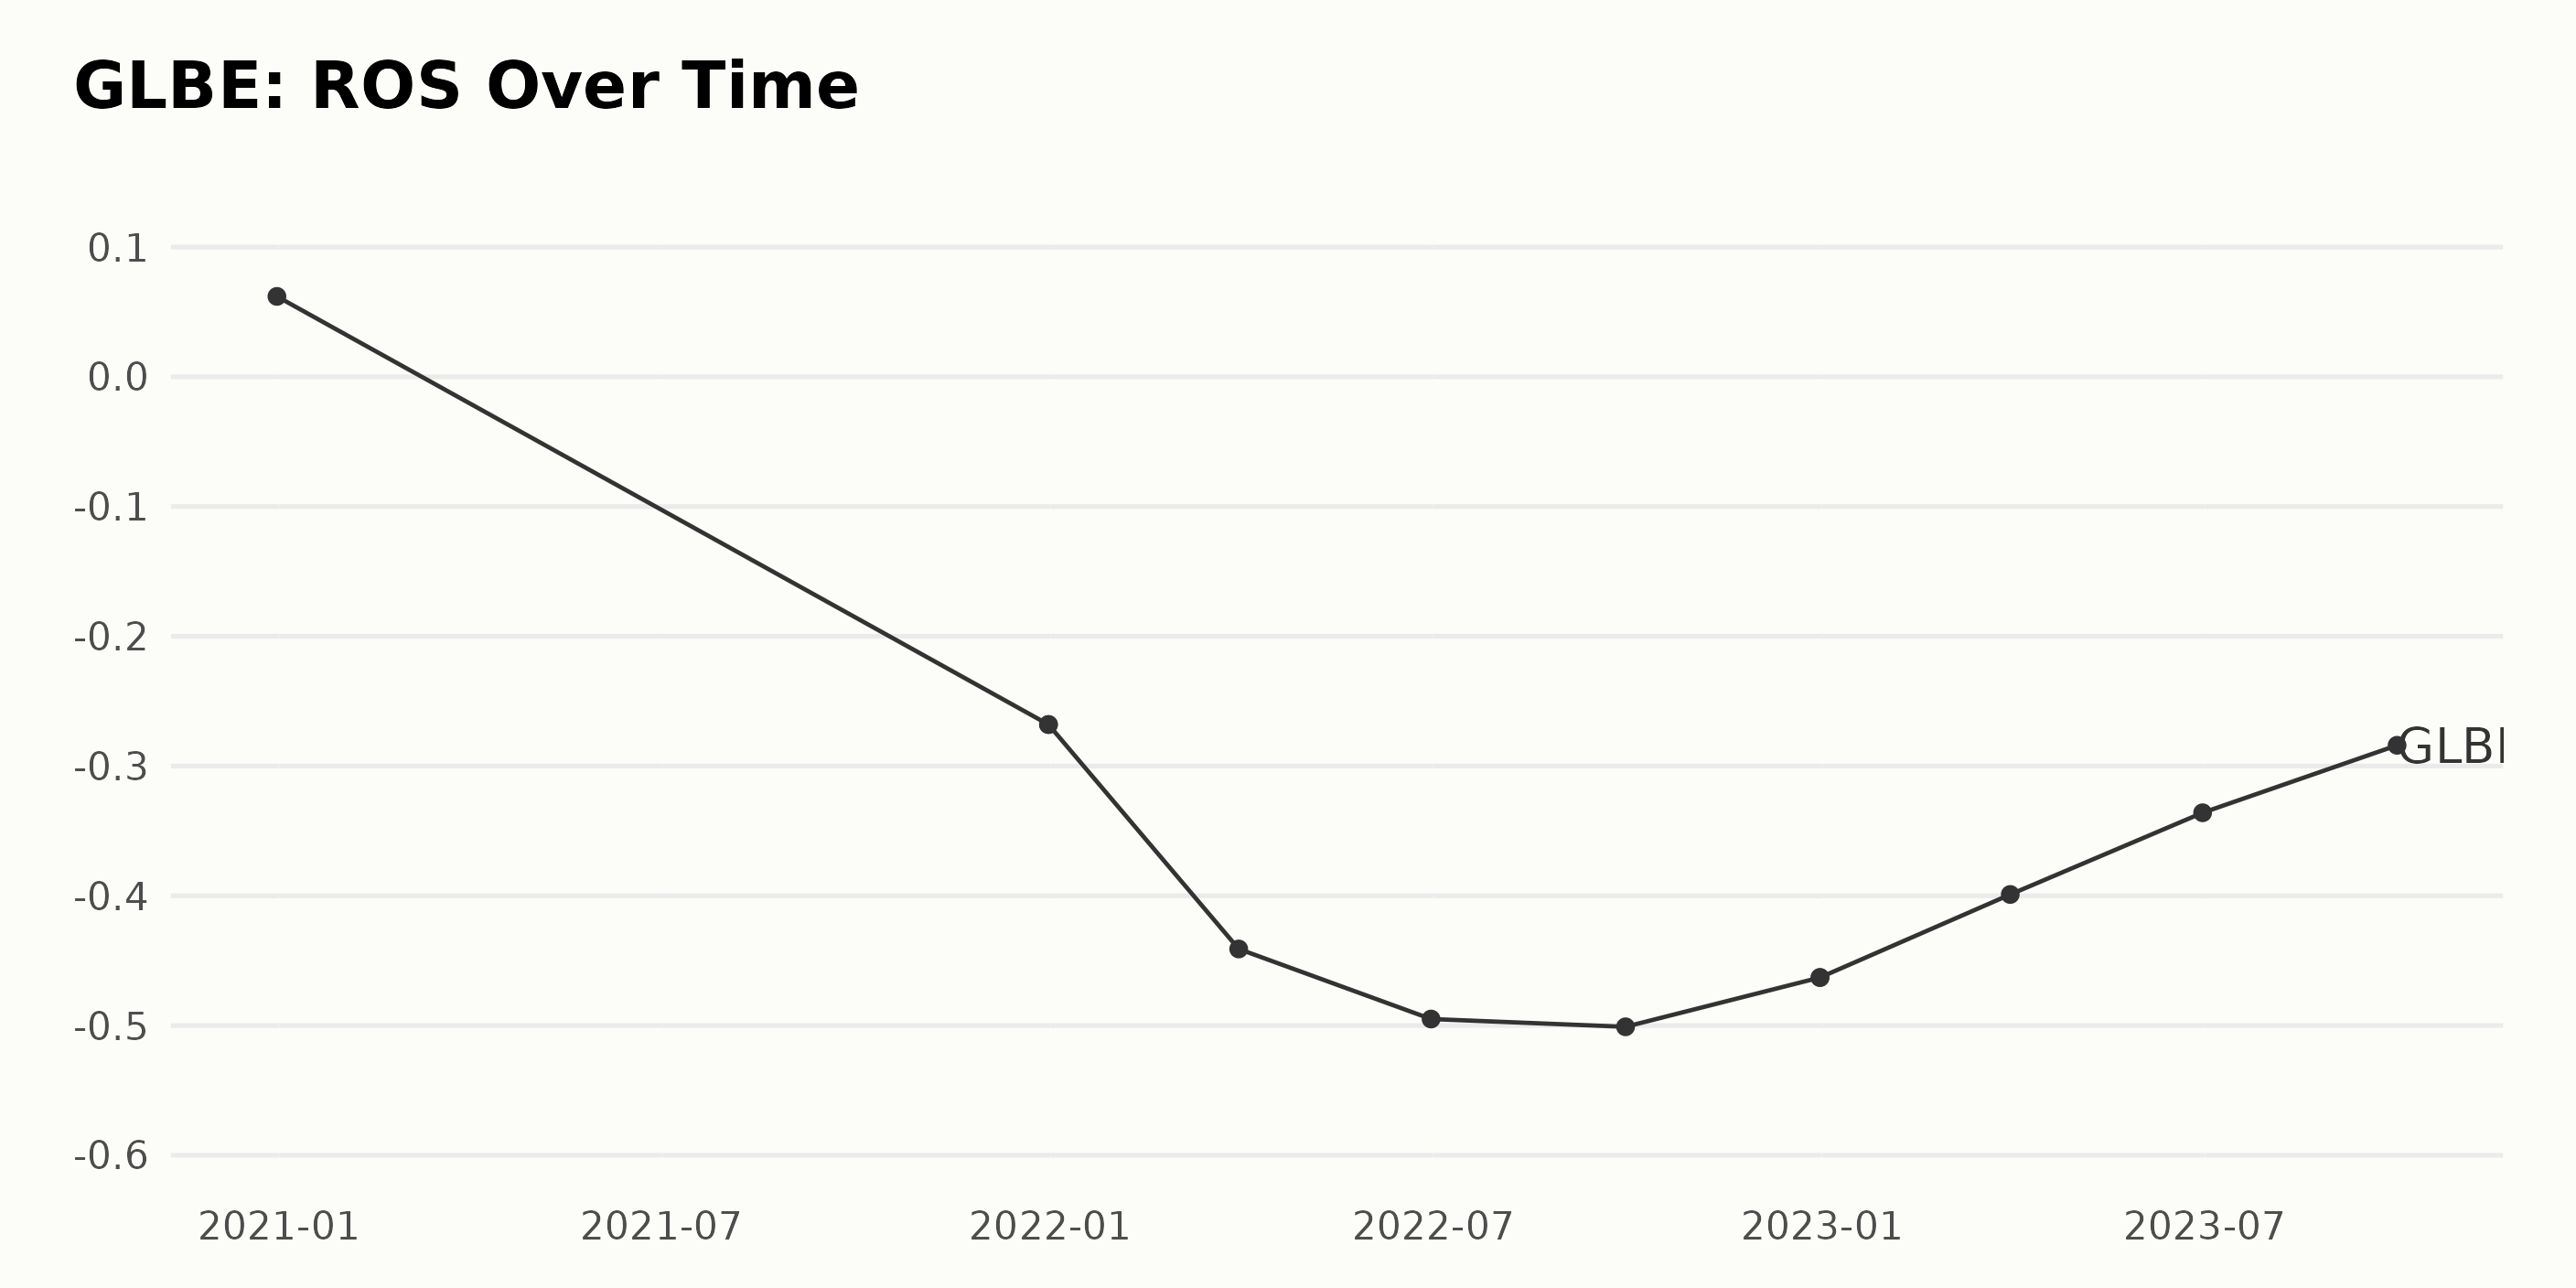
The data series for GLBE covers the Return On Sales (ROS) for the period from December 31, 2020, to September 30, 2023.
- On December 31, 2020, GLBE started with a respectable ROS at 0.062 or 6.2%.
- One year later, on December 31, 2021, there was a significant negative shift in ROS to -0.268 or -26.8%. The same value was reported again at the end of that year.
- Throughout 2022, the ROS trend continued to dip further into the negatives, reaching -0.501 (-50.1%) by September 30. However, there was a slight rebound by the end of the year, with the ROS improving slightly to -0.463 (-46.3%).
- The last reported data from the first three quarters of 2023 indicate a gradual uptrend in ROS, rising from -0.399 (-39.9%) at March-end, -0.336 (-33.6%) at June-end, and -0.284 (-28.4%) at September-end.
Overall, the ROS for GLBE experienced a significant negative fluctuation from its initial value to its lowest point but has since been trending upwards. By focusing on more recent data (from 2022 onward), we see a trend of gradual recovery, still in the negatives but consistently lessening its deficit.
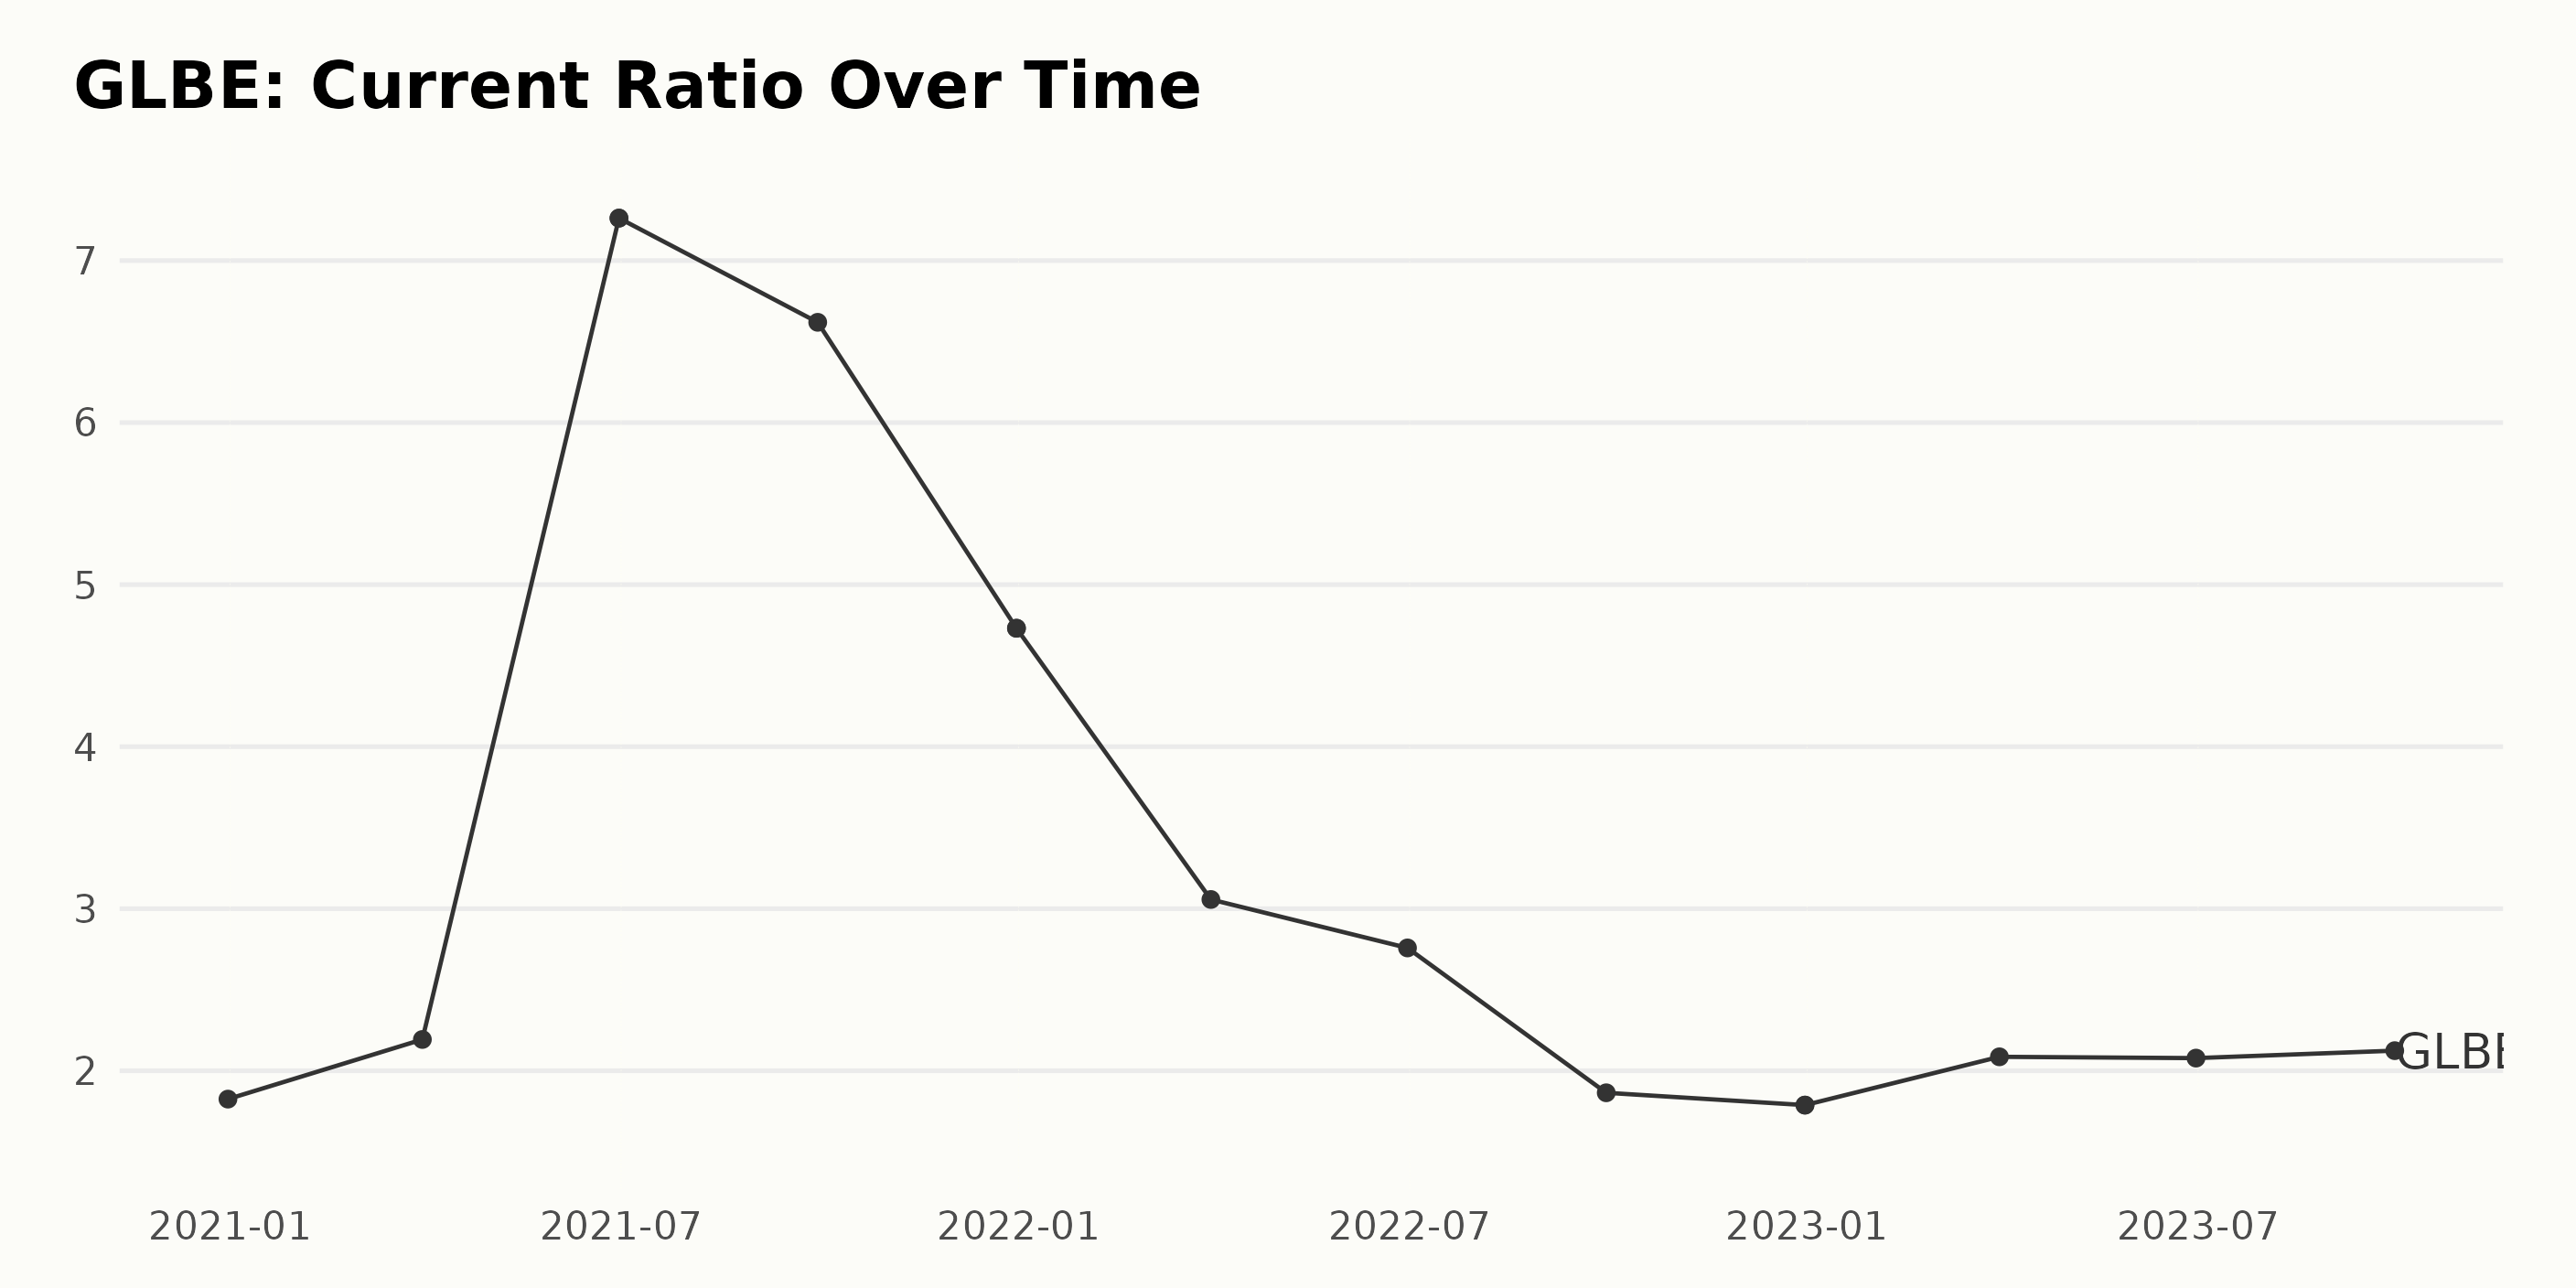
The current ratio of GLBE has been fluctuating over the examined period from December 2020 to September 2023.
- First, there was a sharp increase from 1.82 in December 2020 to 7.26 in June 2021.
- Thereafter, the ratio saw a downward trend, falling from its peak of 7.26 in June 2021 to 1.79 by December 2022.
- In recent data, however, the ratio has shown signs of mild recovery, inching up from 1.79 in December 2022 to 2.12 by September 2023.
Focusing on the most recent value, as of September 2023, the current ratio is at 2.12. This marks a moderately increased level compared to the low of 1.79 seen in December 2022. With regard to the overall growth rate of the current ratio during this period, it has grown by approximately 16% since its initial value at the start of the examined period.
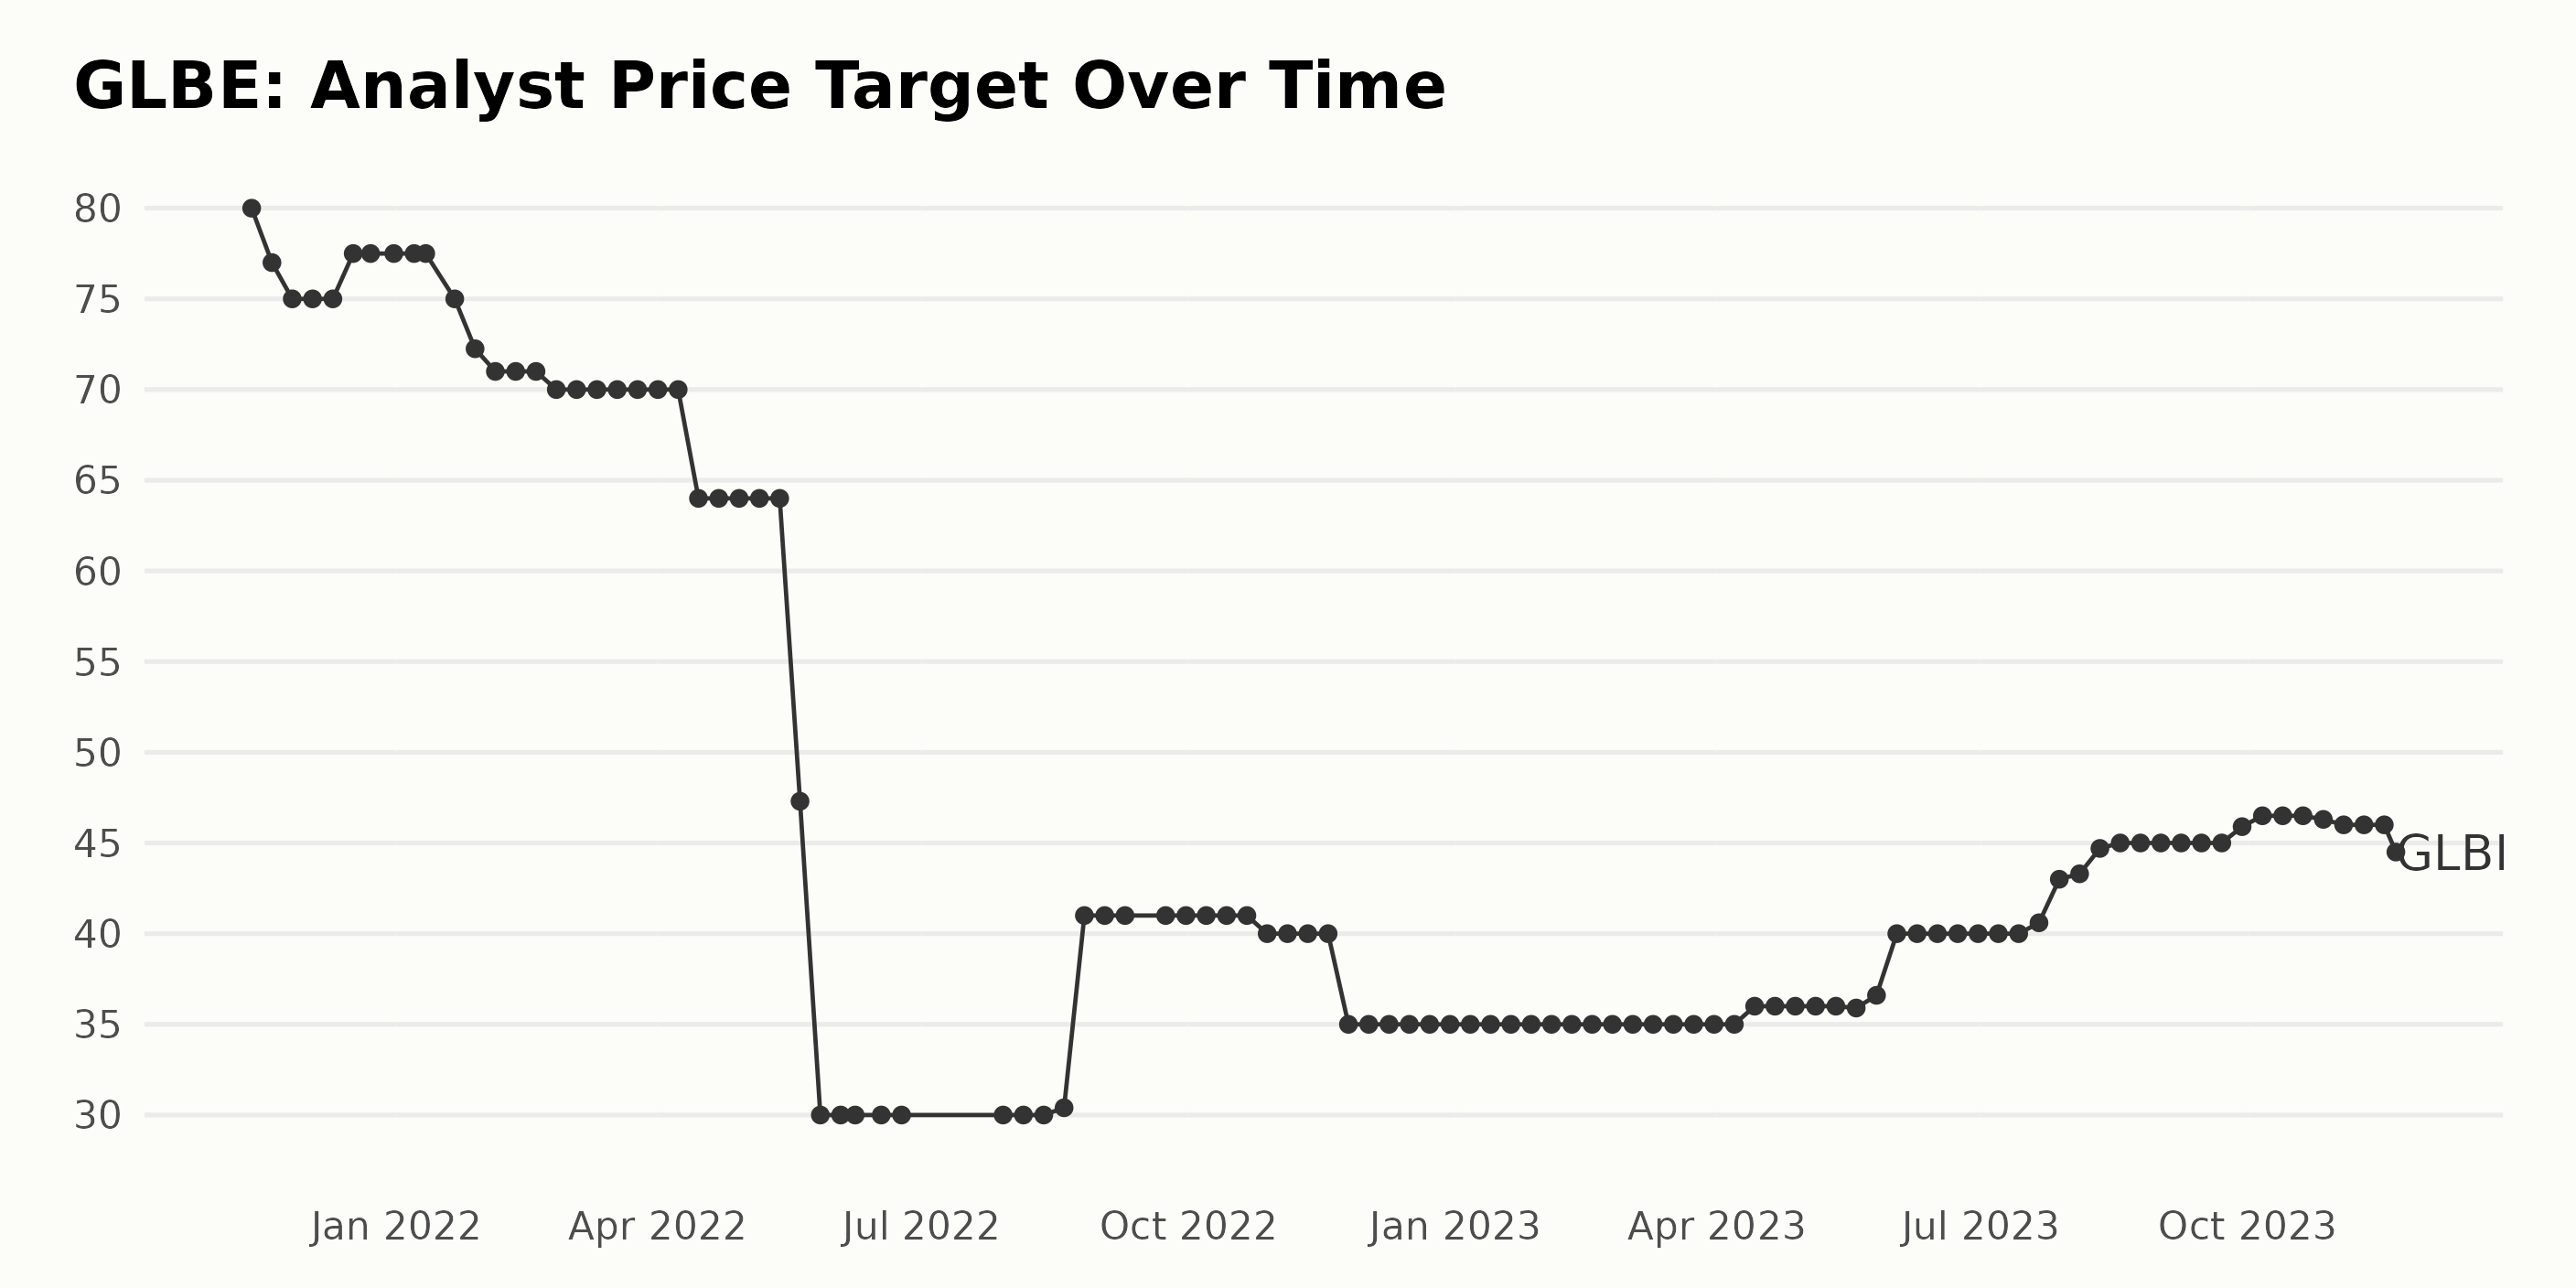
The analyst price target of GLBE has experienced several fluctuations over the specified time period from November 12, 2021, to November 21, 2023.
- The price targets started at $80 in November 2021 and showed a general downward trend until reaching a low of $30 in May 2022. This equates to a decrease of 62.5%.
- From May 2022 to August 2022, there was a period of stability, with the price target remaining constant at $30. Subsequently, the price target slightly increased to $41 by September 2022 and maintained that level until October 2022.
- A slight decrease was observed in November 2022 when the analyst price target decreased again to $35, remaining at this level till April 2023.
- Starting from April 14, 2023, the price targets started to increase gradually, reaching up to $46.5 in October 2023.
- However, toward the end of the period on November 21, 2023, there was an observable dip, with the price target decreasing to $44.5.
Overall, the price targets experienced a negative growth rate of approximately -44.38%, comparing the last value ($44.5) with the first value ($80). We can observe that the steepest decline occurred between April and May 2022, while the sharpest increase happened between July and August 2023. The recent trends as of November 2023 suggest a mild downward trend in the analyst price target.
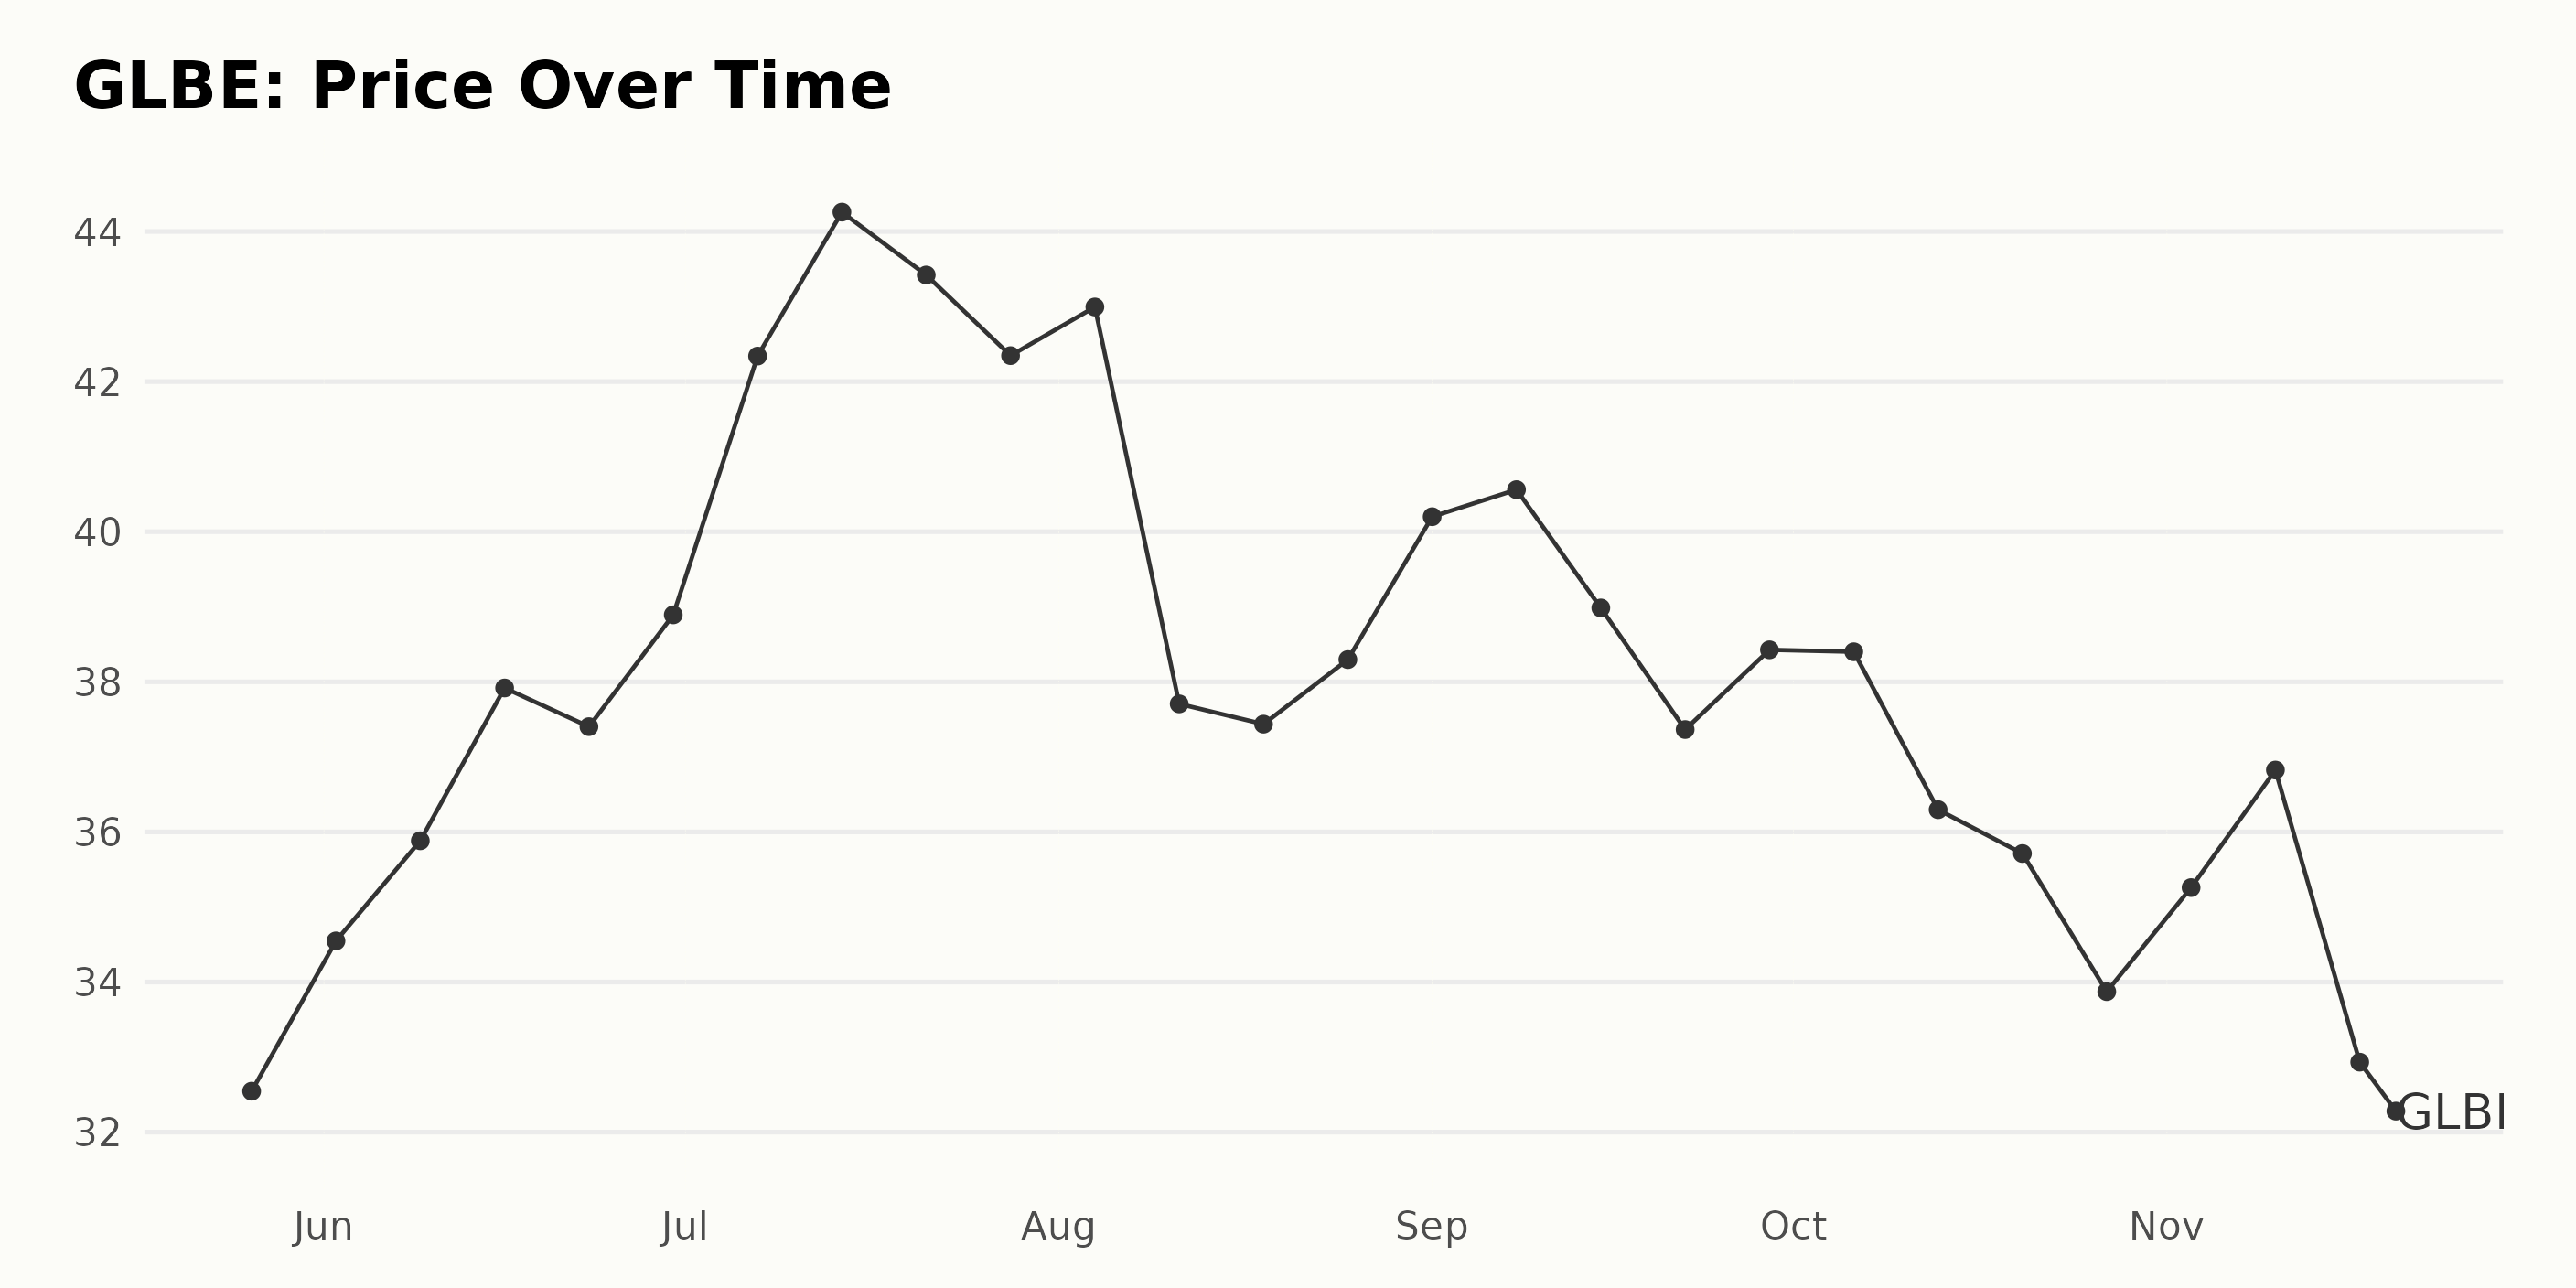
GLBE's Six-Month Share Price Journey: Upward Climb Followed by Steady Descent
Based on the provided data, it can be observed that:
- On May 26, 2023, GLBE started at a share price of $32.55.
- The share price then increased, reaching $34.55 by June 2, 2023. The trend continued upward with a value of $42.34 on July 7, 2023, demonstrating a notable growth period where the price increased steadily for just over a month.
- However, the share price peaked at $44.26 by July 14, 2023, after which it began to decline, with some minor fluctuation, until August 11, 2023, when the share price dropped significantly to $37.71.
- August 2023 saw a slight and temporary recovery in the price, but a steady decline trend commenced from September 8, 2023, with share price gradually decreasing from $40.56 to $36.30 on October 13, 2023.
- This downward trend continued till November 20, 2023, with intermittent minor increases, resulting in the closing share price of $31.91.
Over this approximately six-month period, GLBE had a fluctuating growth rate characterized by periods of both acceleration and deceleration. The overall trend, however, seems to be negative given the lower ending point relative to the starting share price. Here is a chart of GLBE's price over the past 180 days.
Analyzing GLBE's Performance: Growth, Momentum, and Sentiment Trends in 2023
The POWR Ratings Grade for GLBE, a stock in the 28-stock Internet - Services category, is currently ranked as D (Sell). This grade has been consistently maintained by the stock throughout a considerable timespan within the year 2023. Specifically:
- As of the week of May 27, 2023, GLBE had a POWR Grade of D (Sell) and was ranked #28 in its category.
- This same POWR Grade and rank persisted till the week of June 17, 2023, when the rank improved slightly to #27.
- Throughout July and August of 2023, the POWR Grade remained D (Sell), with minor fluctuations in its category rank between #27 and #29.
- In September 2023, GLBE maintained its D (Sell) POWR Grade but managed to improve its place in the category rank to #26 and even #24 by the end of that month.
- During October 2023, the D (Sell) POWR Grade continued to be held by GLBE, and its rank within the category varied slightly between #23 and #24.
- By November 21, 2023, the stock retained its D (Sell) POWR Grade and dropped back to a rank of #25 within its category.
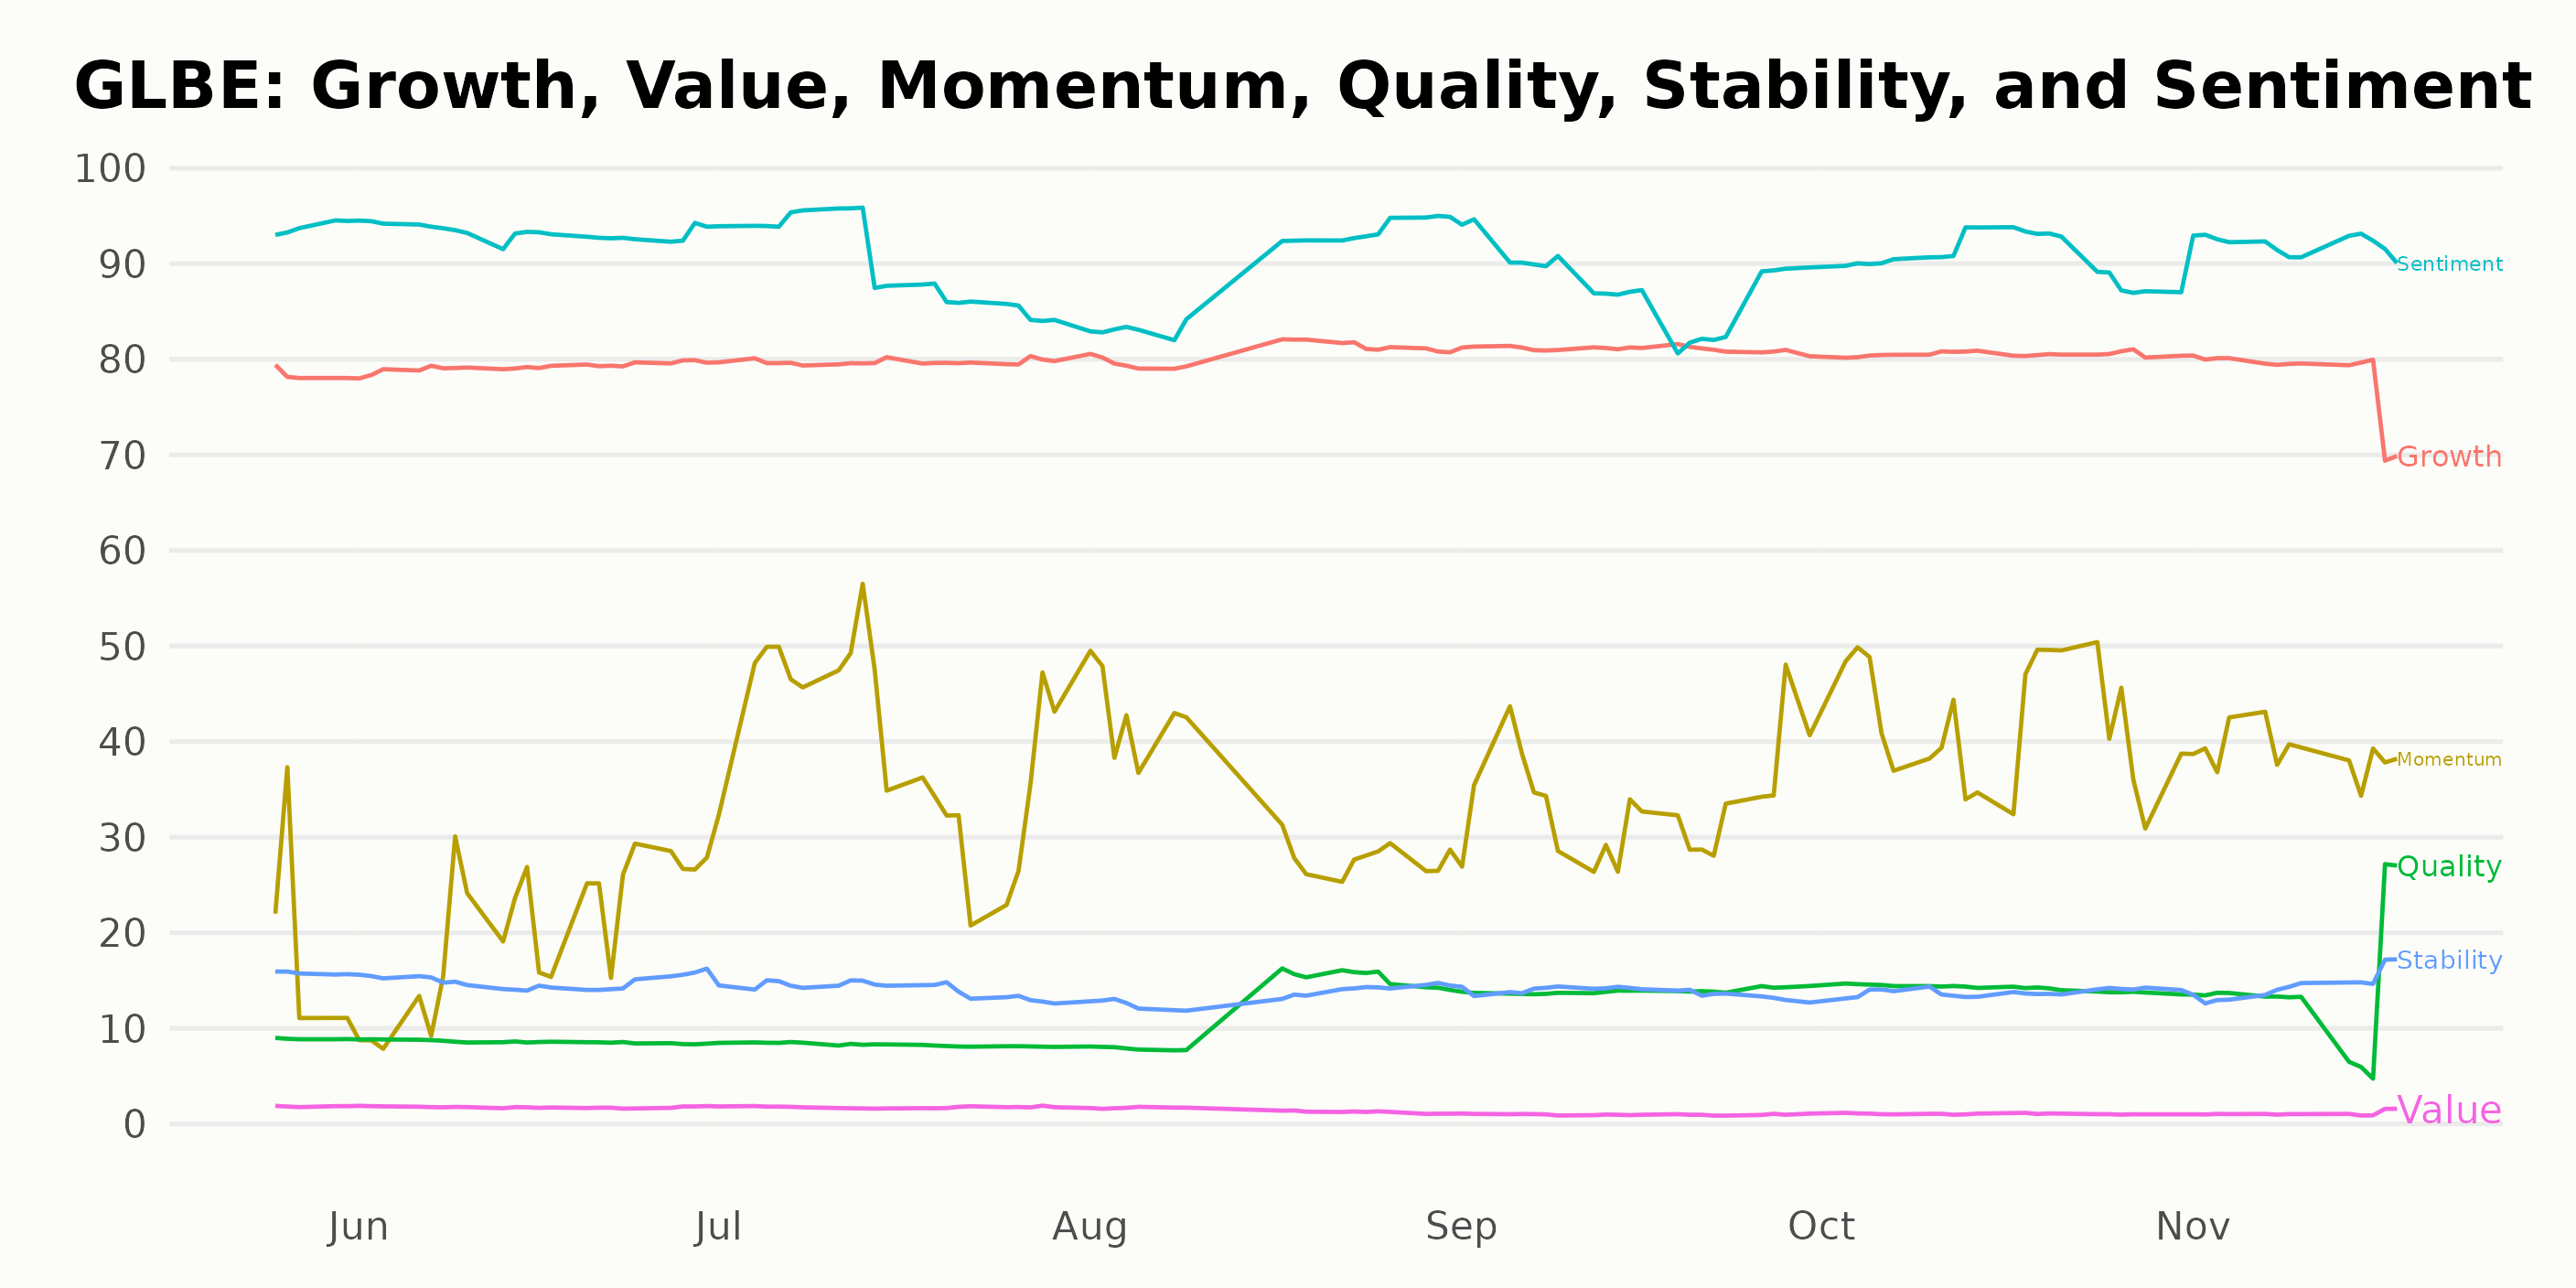
The POWR Ratings for GLBE indicate the overall performance and trends along various dimensions. Given the specifications provided, the most noteworthy dimensions are Growth, Momentum, and Sentiment. These three factors can be fundamental to understanding any notable characteristics of GLBE.
Growth: The Growth rating indicates an upward trend for GLBE over the course of 2023. Starting at a substantial rating of 78 in May, the rating increases steadily to reach a high of 81 by September. This represents a consistent growth over several months. However, there is a slight decrease in November when the rating comes down to 78.
Momentum: Momentum seemed to have a considerable fluctuation throughout the period. In May 2023, the Momentum factor recorded a score of 19, which saw a slight increase to 20 by June. A remarkable leap was noticed in July when the value doubled to 40. It further experienced highs and lows, reaching 42 in October before settling at 39 by mid-November.
Sentiment: As per the given data, the Sentiment rating remained consistently high throughout, exhibiting a slight downward trend from May to September, ranging from 94 to 88. However, despite this slight decrease, Sentiment regained strength and climbed to 91 in October and settled at a high of 92 by mid-November.
In conclusion, while GLBE's Growth shows a stable upward trend with minor fluctuations, both Sentiment and Momentum ratings show more volatility throughout 2023. Despite some decrease, the Sentiment factor has remained relatively high overall, indicating positive market feelings toward GLBE.
How does Global-e Online Ltd. (GLBE) Stack Up Against its Peers?
Other stocks in the Internet - Services sector that may be worth considering are Liquidity Services, Inc. (LQDT), Similarweb Ltd. (SMWB), and Wix.com Ltd. (WIX) - they have better POWR Ratings. Click here to explore more Internet - Services stocks.
What To Do Next?
Discover 10 widely held stocks that our proprietary model shows have tremendous downside potential. Please make sure none of these “death trap” stocks are lurking in your portfolio:
GLBE shares were trading at $31.25 per share on Tuesday morning, down $0.66 (-2.07%). Year-to-date, GLBE has gained 51.41%, versus a 19.52% rise in the benchmark S&P 500 index during the same period.
About the Author: Anushka Dutta

Anushka is an analyst whose interest in understanding the impact of broader economic changes on financial markets motivated her to pursue a career in investment research.
The post Is Global-e Online (GLBE) an Internet Retail Stock to Buy Now? appeared first on StockNews.com