


Starbucks Corporation (SBUX), a multinational coffee company and coffeehouse chain, is set to report its fourth-quarter financials on November 2. The third quarter (which ended on July 2) saw a significant spike in the company's sales within the Chinese market, whereas North America experienced more muted results.
Comparable store sales showed a growth of 10%, missing the StreetAccount estimates that predicted an increase of 11%. In addition, comparable store sales expansion within North America was reported at 7%, falling short of the estimated expectation of 8.4%.
The total net revenues for SBUX in the third quarter amounted to $9.17 billion, less than the anticipated $9.29 billion. However, a silver lining presented itself in the form of the corporation's non-GAAP EPS, which exceeded the analyst estimate of $0.95 to reach $1.00 in the same quarter.
Outlining its expectations for fiscal year 2023, SBUX forecasted revenue growth between 10% and 12% while also elevating its adjusted EPS growth outlook from the initial range of 15%-20% to a higher 16%-17%.
Given these variable results, it is valuable to investigate SBUX's key financial metrics trends to comprehend the potential benefits of awaiting a more favorable stock entry point.
Starbucks Corporation's Financial Performance Analysis: December 2020 - July 2023
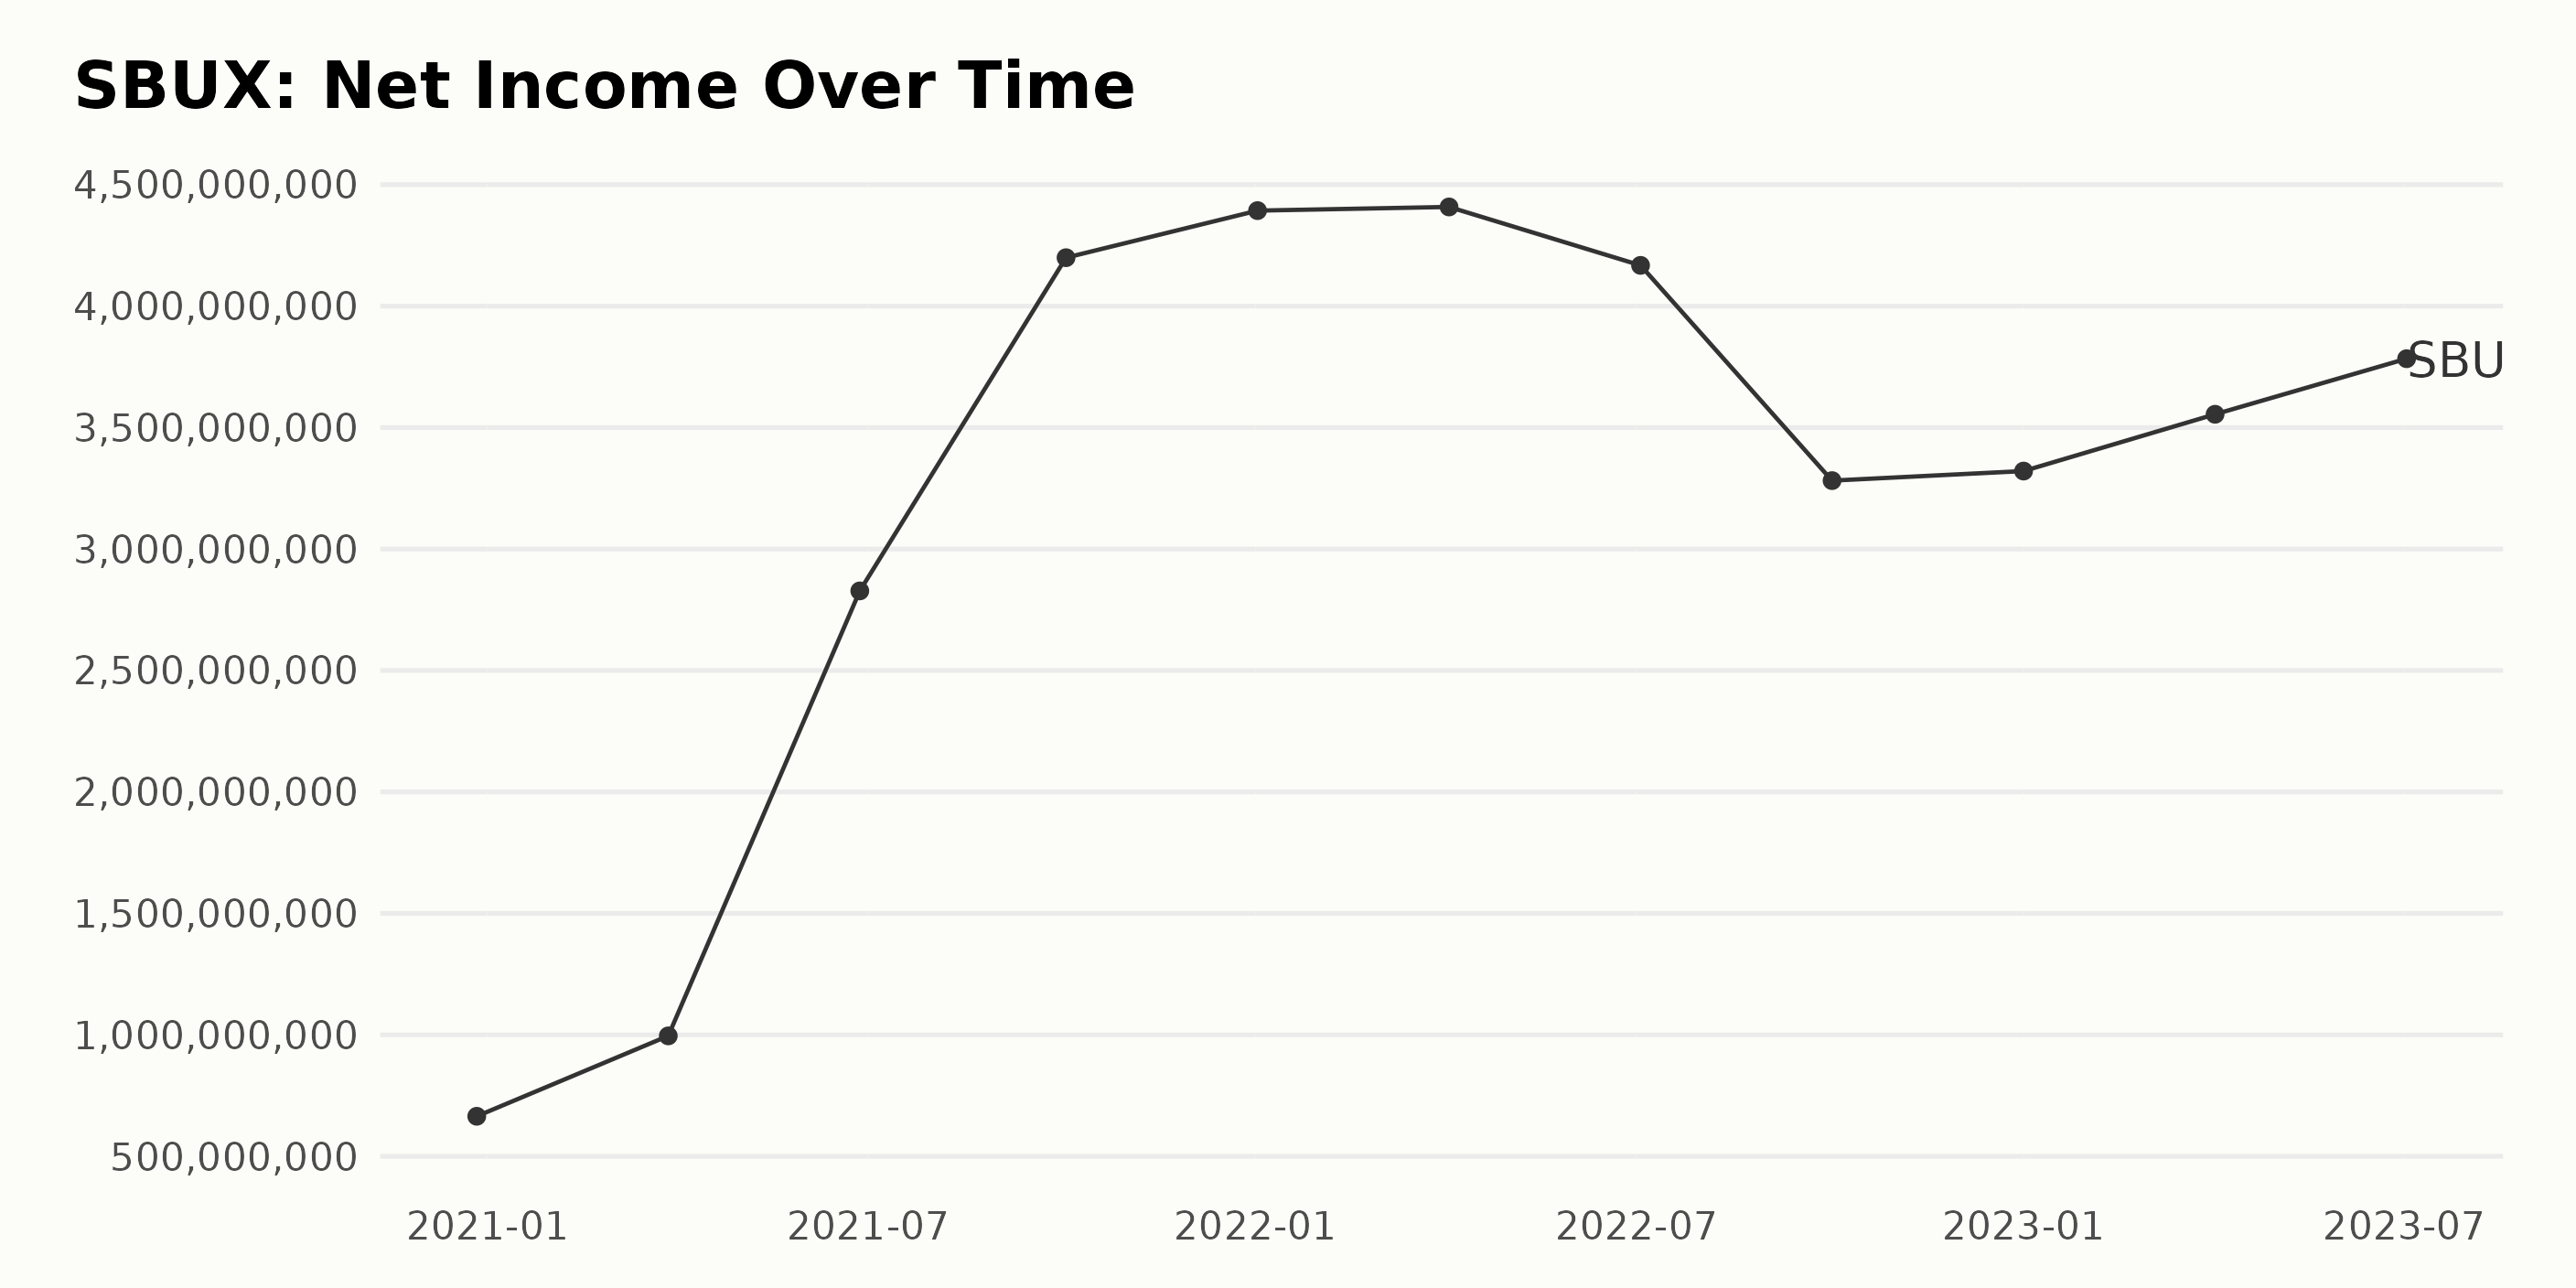
The trailing-12-month net income of SBUX demonstrated a significant upward trend over the time period from December 27, 2020, to July 2, 2023. It experienced notable fluctuations, with a trajectory generally increasing over the years but with some periods of decline.
- On December 27, 2020, the net income stood at $664.8 million.
- A steady increase was observed in 2021, peaking on October 3, 2021, at $4.20 billion, an impressive growth from the figure reported earlier on March 28, 2021 ($995.8 million).
- The company enjoyed its highest net income on April 3, 2022, reaching $4.41 billion, slightly above the beginning of the year, January 2, 2022 ($4.39 billion).
- However, it experienced a brief period of decline in the third and fourth quarters of 2022, with the net income dropping to $3.28 billion by October 2, 2022.
- The first quarter of 2023 saw a slight rebound to $3.32 billion.
- From April 2, 2023, the net income demonstrated a significant resurgence, closing at $3.78 billion by July 2, 2023.
From the initial value of $664.8 million in December 2020 to the final recorded value of $3.78 billion in July 2023, SBUX's net income increased by approximately 469%, showcasing notable income growth despite evident periods of instability.
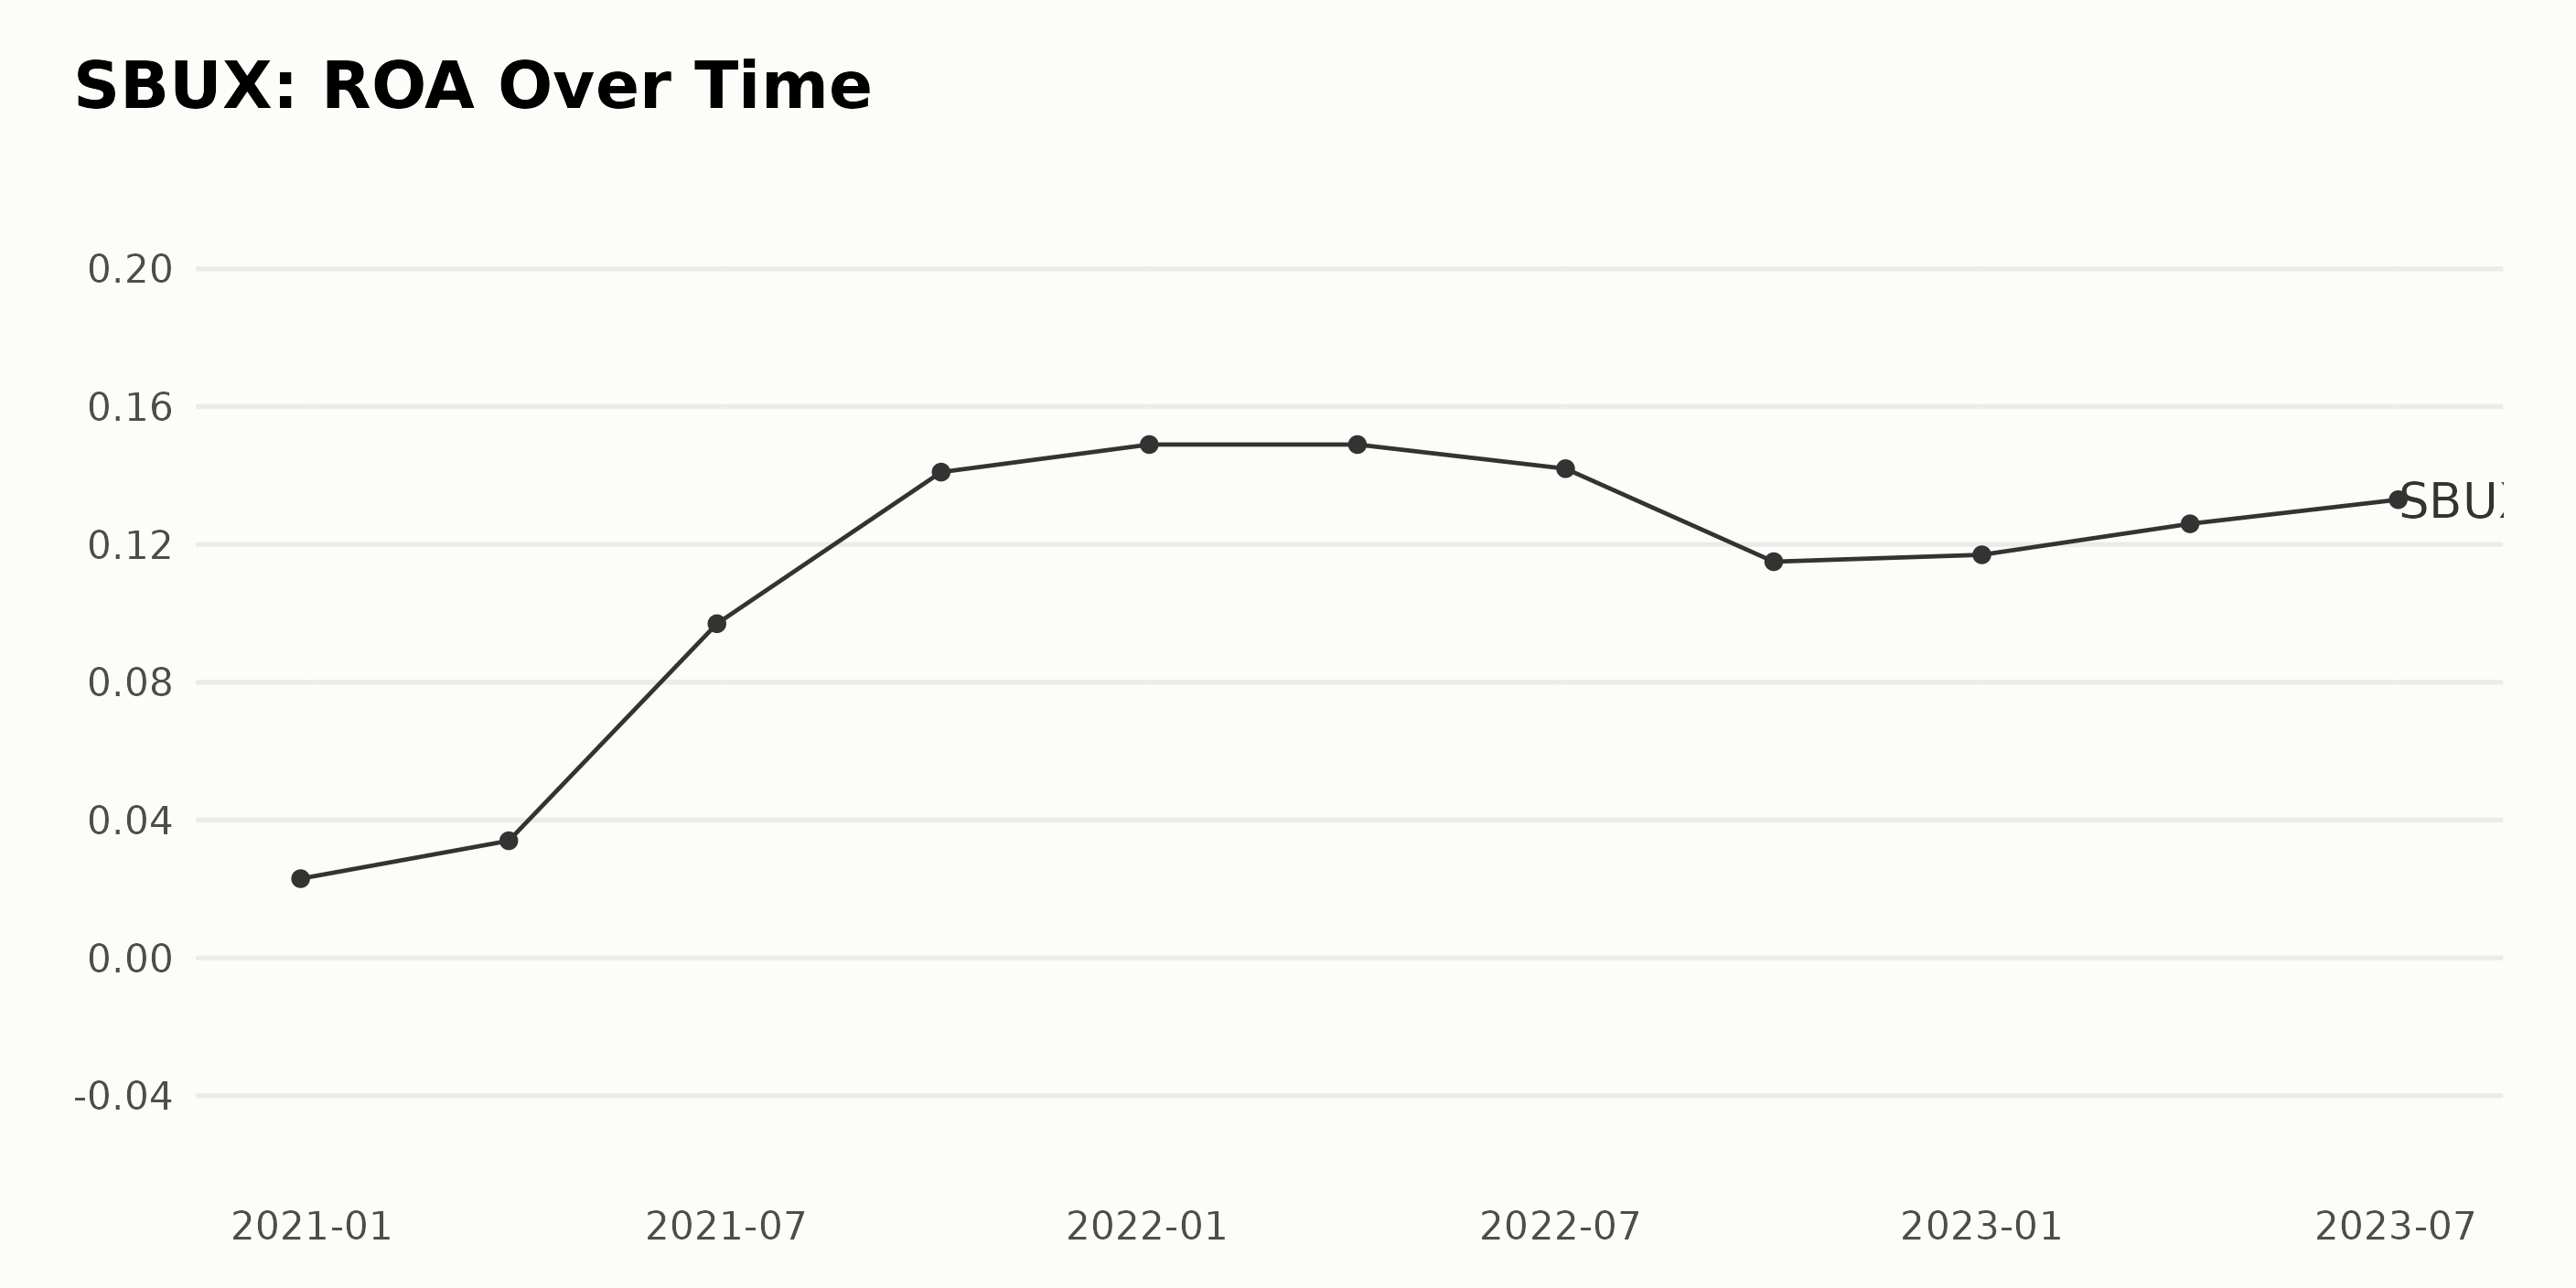
The ROA (Return On Assets) recorded for SBUX has exhibited a significant increase from December 27, 2020, to July 2, 2023.
- Starting with a low of 0.023 in December 2020, there was consistent growth until October 3, 2021, when SBUX recorded its highest ROA of 0.141.
- This was followed by slight fluctuations in the years 2022 and 2023. The ROA dropped to 0.115 in October 2022 but gradually recovered to reach 0.133 on July 2, 2023.
Overall, the growth rate measured from the first value to the last demonstrates an impressive increment of over 478%. The heightened recent performance, coupled with the recovery trend in 2023, highlights an impactful trend in SBUX's ROA.
The underlying fluctuations could be attributed to numerous factors, including changes in operational efficiency, business strategy adjustments, or shifting market contexts. It remains key to review these nuances when comprehending SBUX's financial strides.
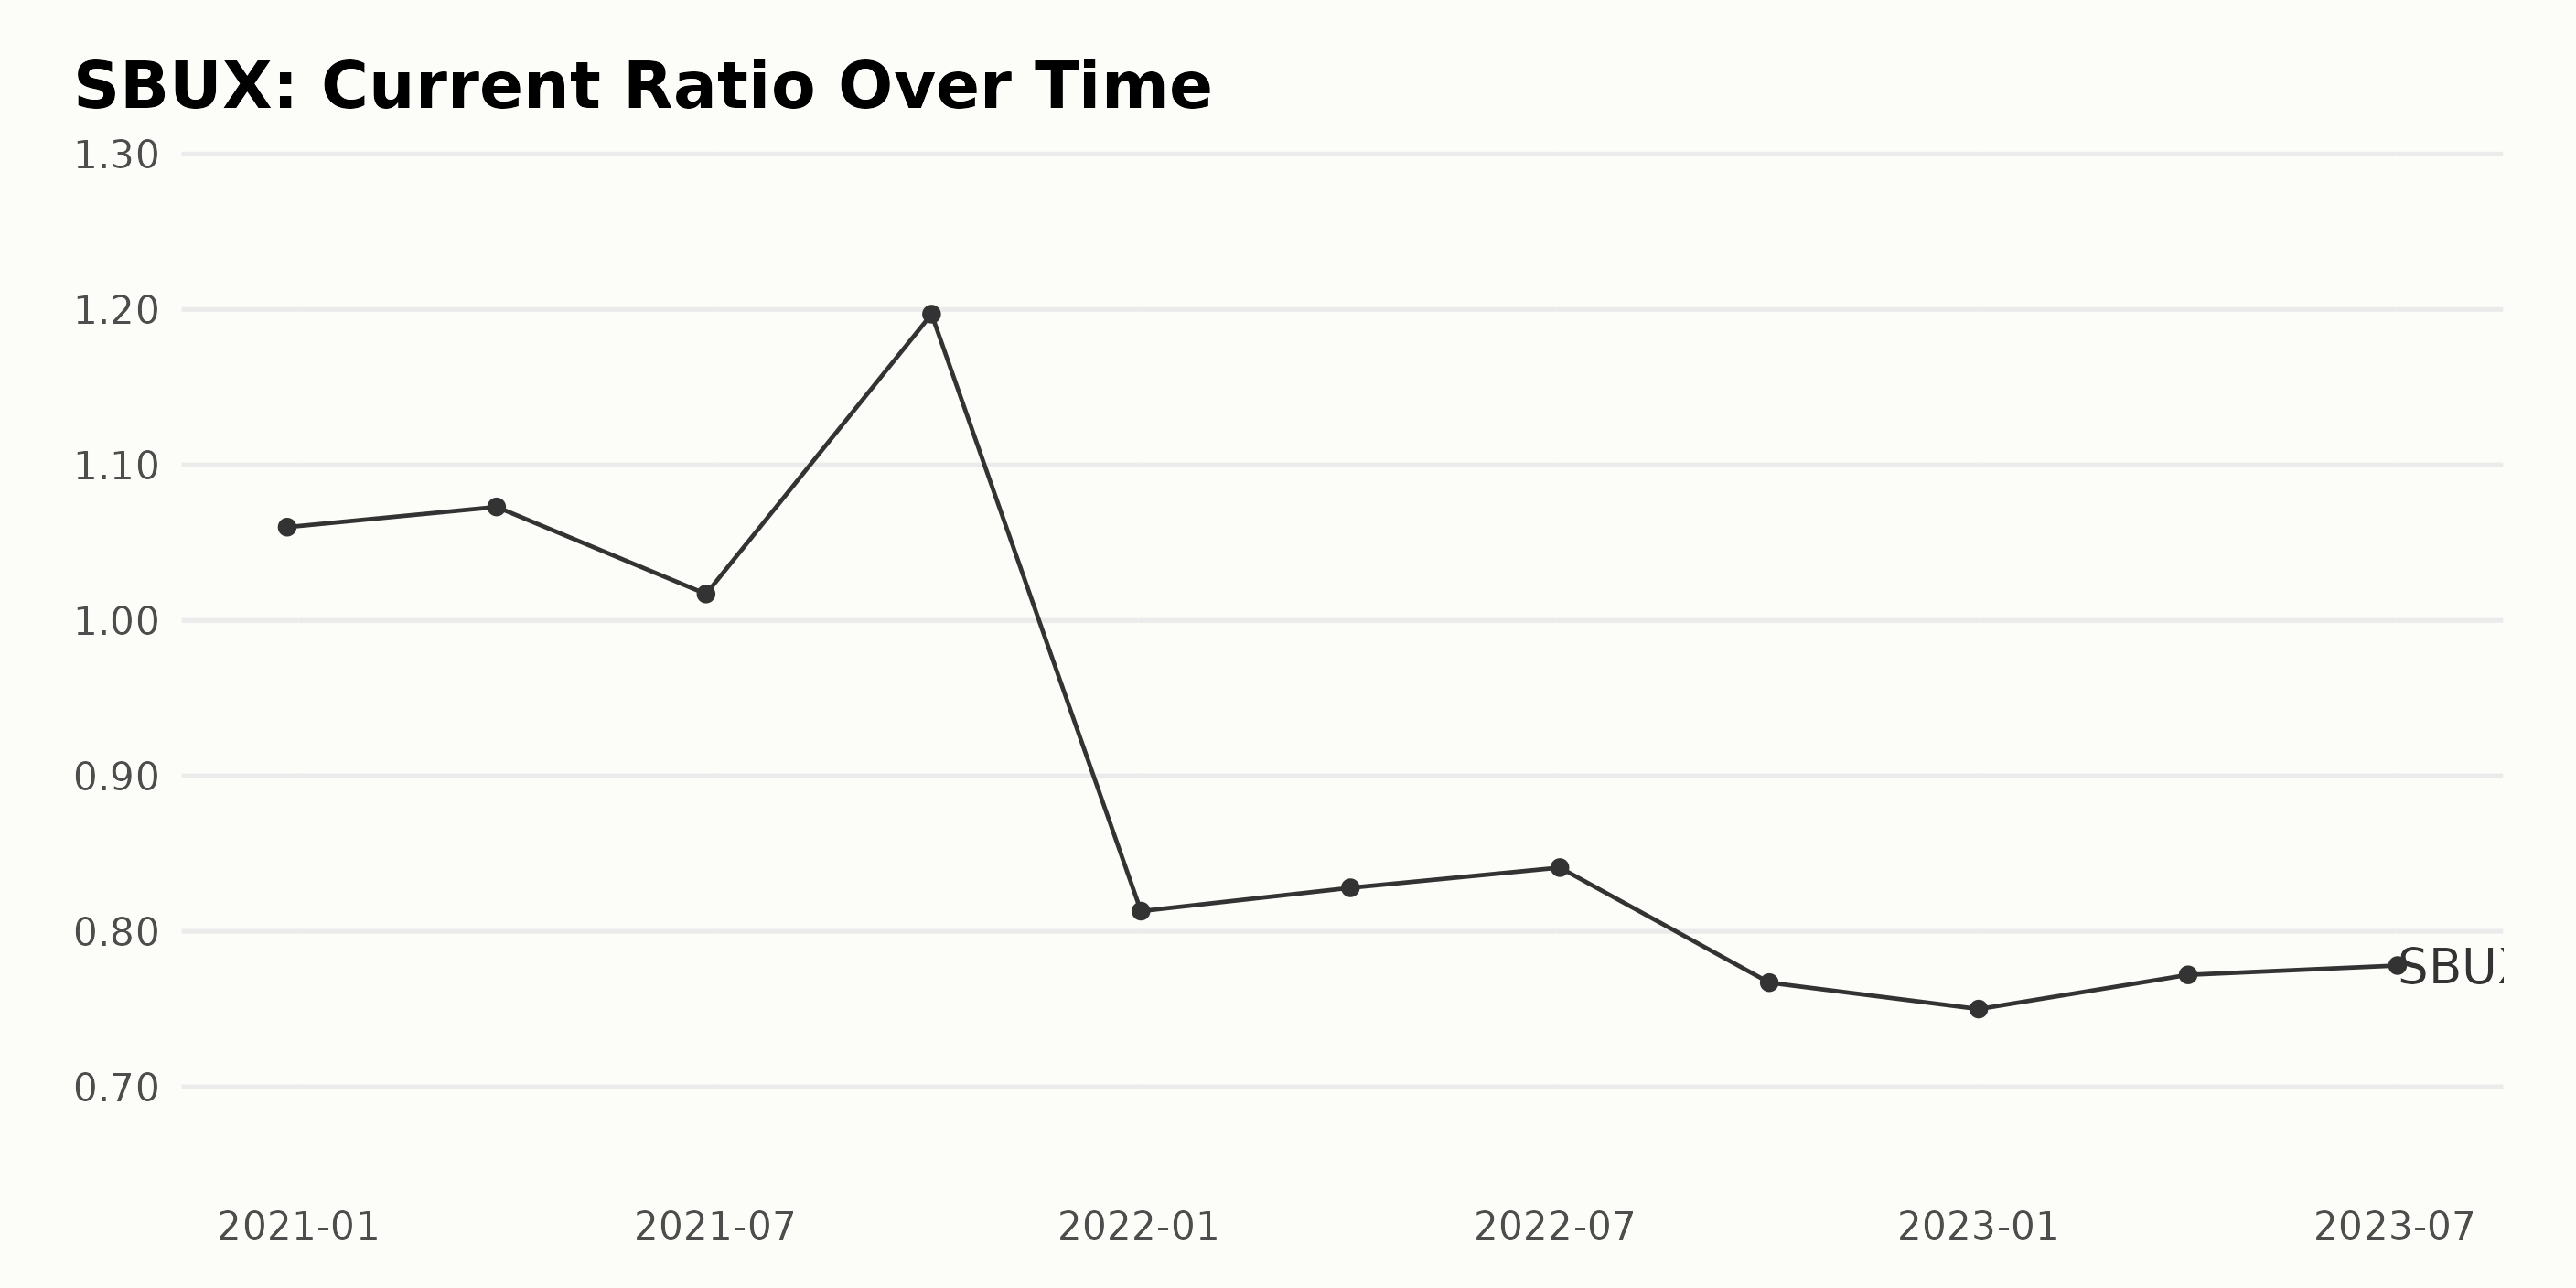
The current ratio of SBUX has exhibited a downward trend over the examined period from December 2020 to July 2023. Here is a concise summary of its fluctuation:
- Starting at 1.06 on December 27, 2020, the current ratio initially increased slightly to reach 1.07 by March 2021.
- However, it dropped to 1.01 by June 2021 before experiencing a temporary increase to 1.19 in October 2021.
- From 2022 onwards, there was a significant decline. The current ratio stood at 0.81 in January 2022 and continued downhill to 0.76 in October 2022.
- Throughout 2023, even though the current ratio experienced small increases - up to 0.77 in April and later to 0.78 by July - it remained well below earlier values.
Overall, comparing the most recent value from July 2023 (0.78) with the initial one from December 2020 (1.06), it can be calculated that there has been almost a 26% decrease in the current ratio of SBUX.
While there were some minor upward fluctuations, they did not offset the overriding downward trend across the data series. Greater emphasis should be placed on the data from 2022 onward due to the pronounced decrease, which reflects the company's declining ability to cover its short-term liabilities with its short-term assets.
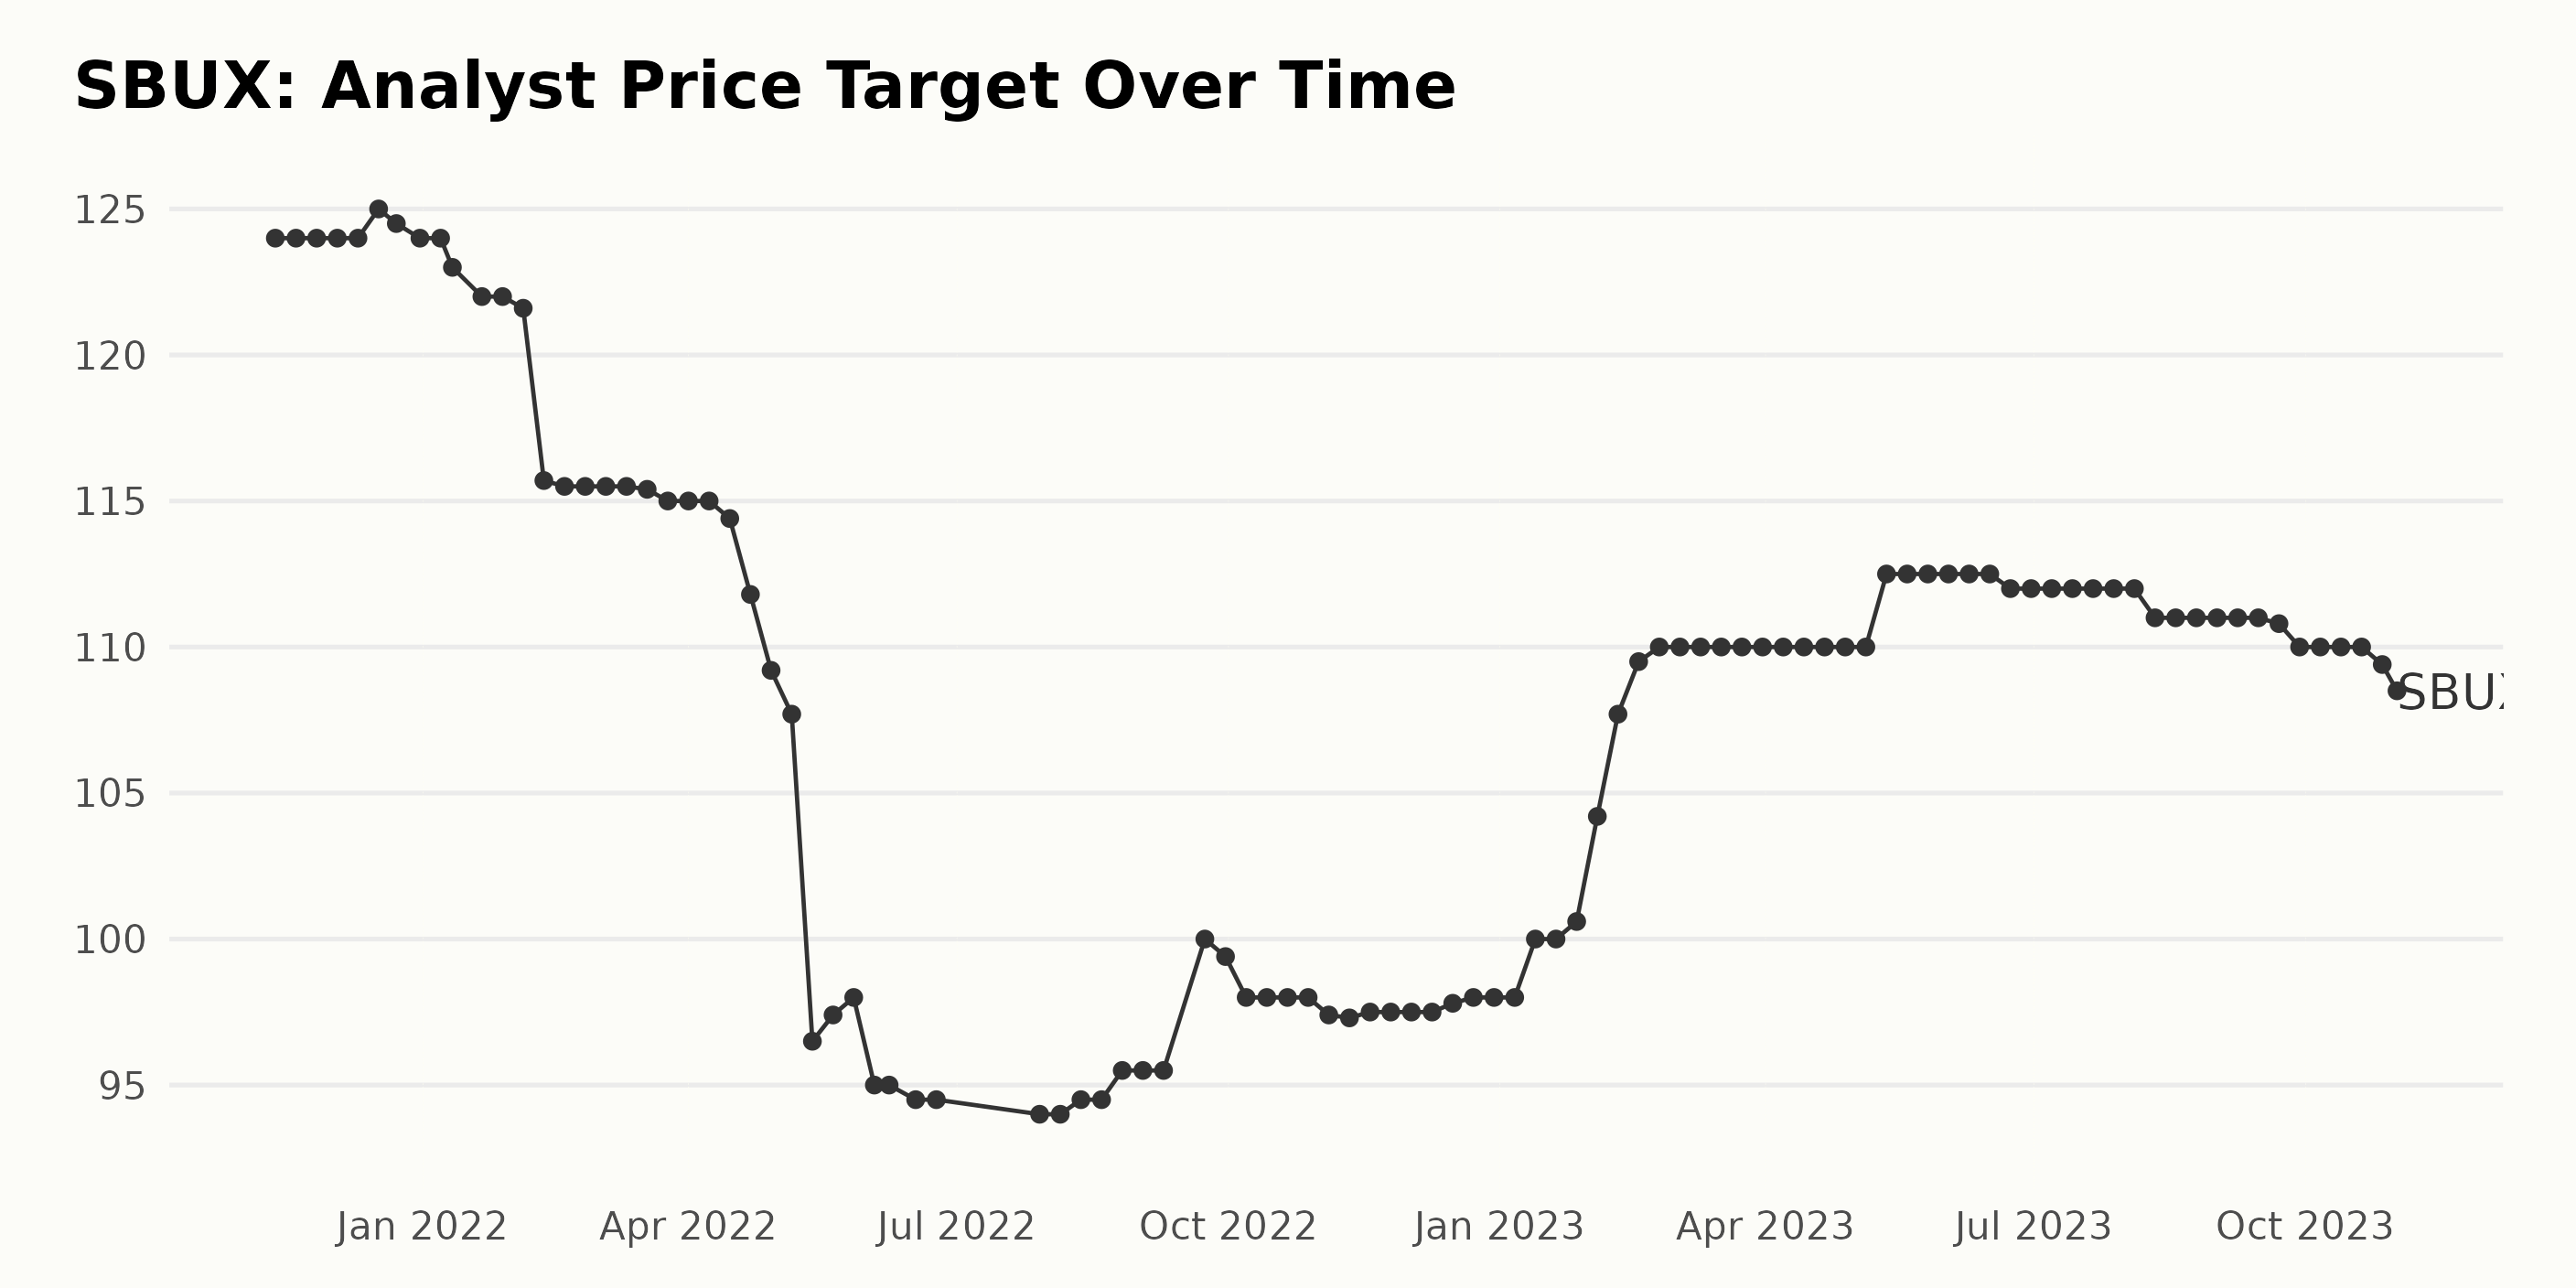
The analyst price target of SBUX displayed a fluctuating trend from November 2021 to November 2023, according to the reported data, although with certain noteworthy patterns.
- Starting in November 2021, the value of the analyst price target began at $124, maintaining around this level until December 2021. At the end of December 2021, a subtle decrease was observed, bringing it down to 123.
- During the early months of 2022, the price target witnessed a substantial decrease, reaching its lowest by mid-May at $96.5. This was followed by a slow rise until September when it hiked to $100.
- Notably, in April 2023, the price target started experiencing a consistent surge, reaching its peak at $112.5 by May 2023.
- Afterward, the value entered another period of fluctuation but hovered roughly around $111.
- Ultimately, the price target closed at $108.5 on November 1, 2023, representing a drop of approximately 12% compared to the starting target in November 2021.
Notwithstanding these fluctuations, it's important to account for the general perspective that the trend from recent data (from 2023) indicates an upsurge since the significant low experienced in May 2022.
Based on the last pieces of available data, the firm seems to be maintaining a steady analyst price target level above $110, with slight downward adjustments towards the end of the measured period.
2023 Stock Trend Analysis: Starbucks Shares Experience Steady Decline
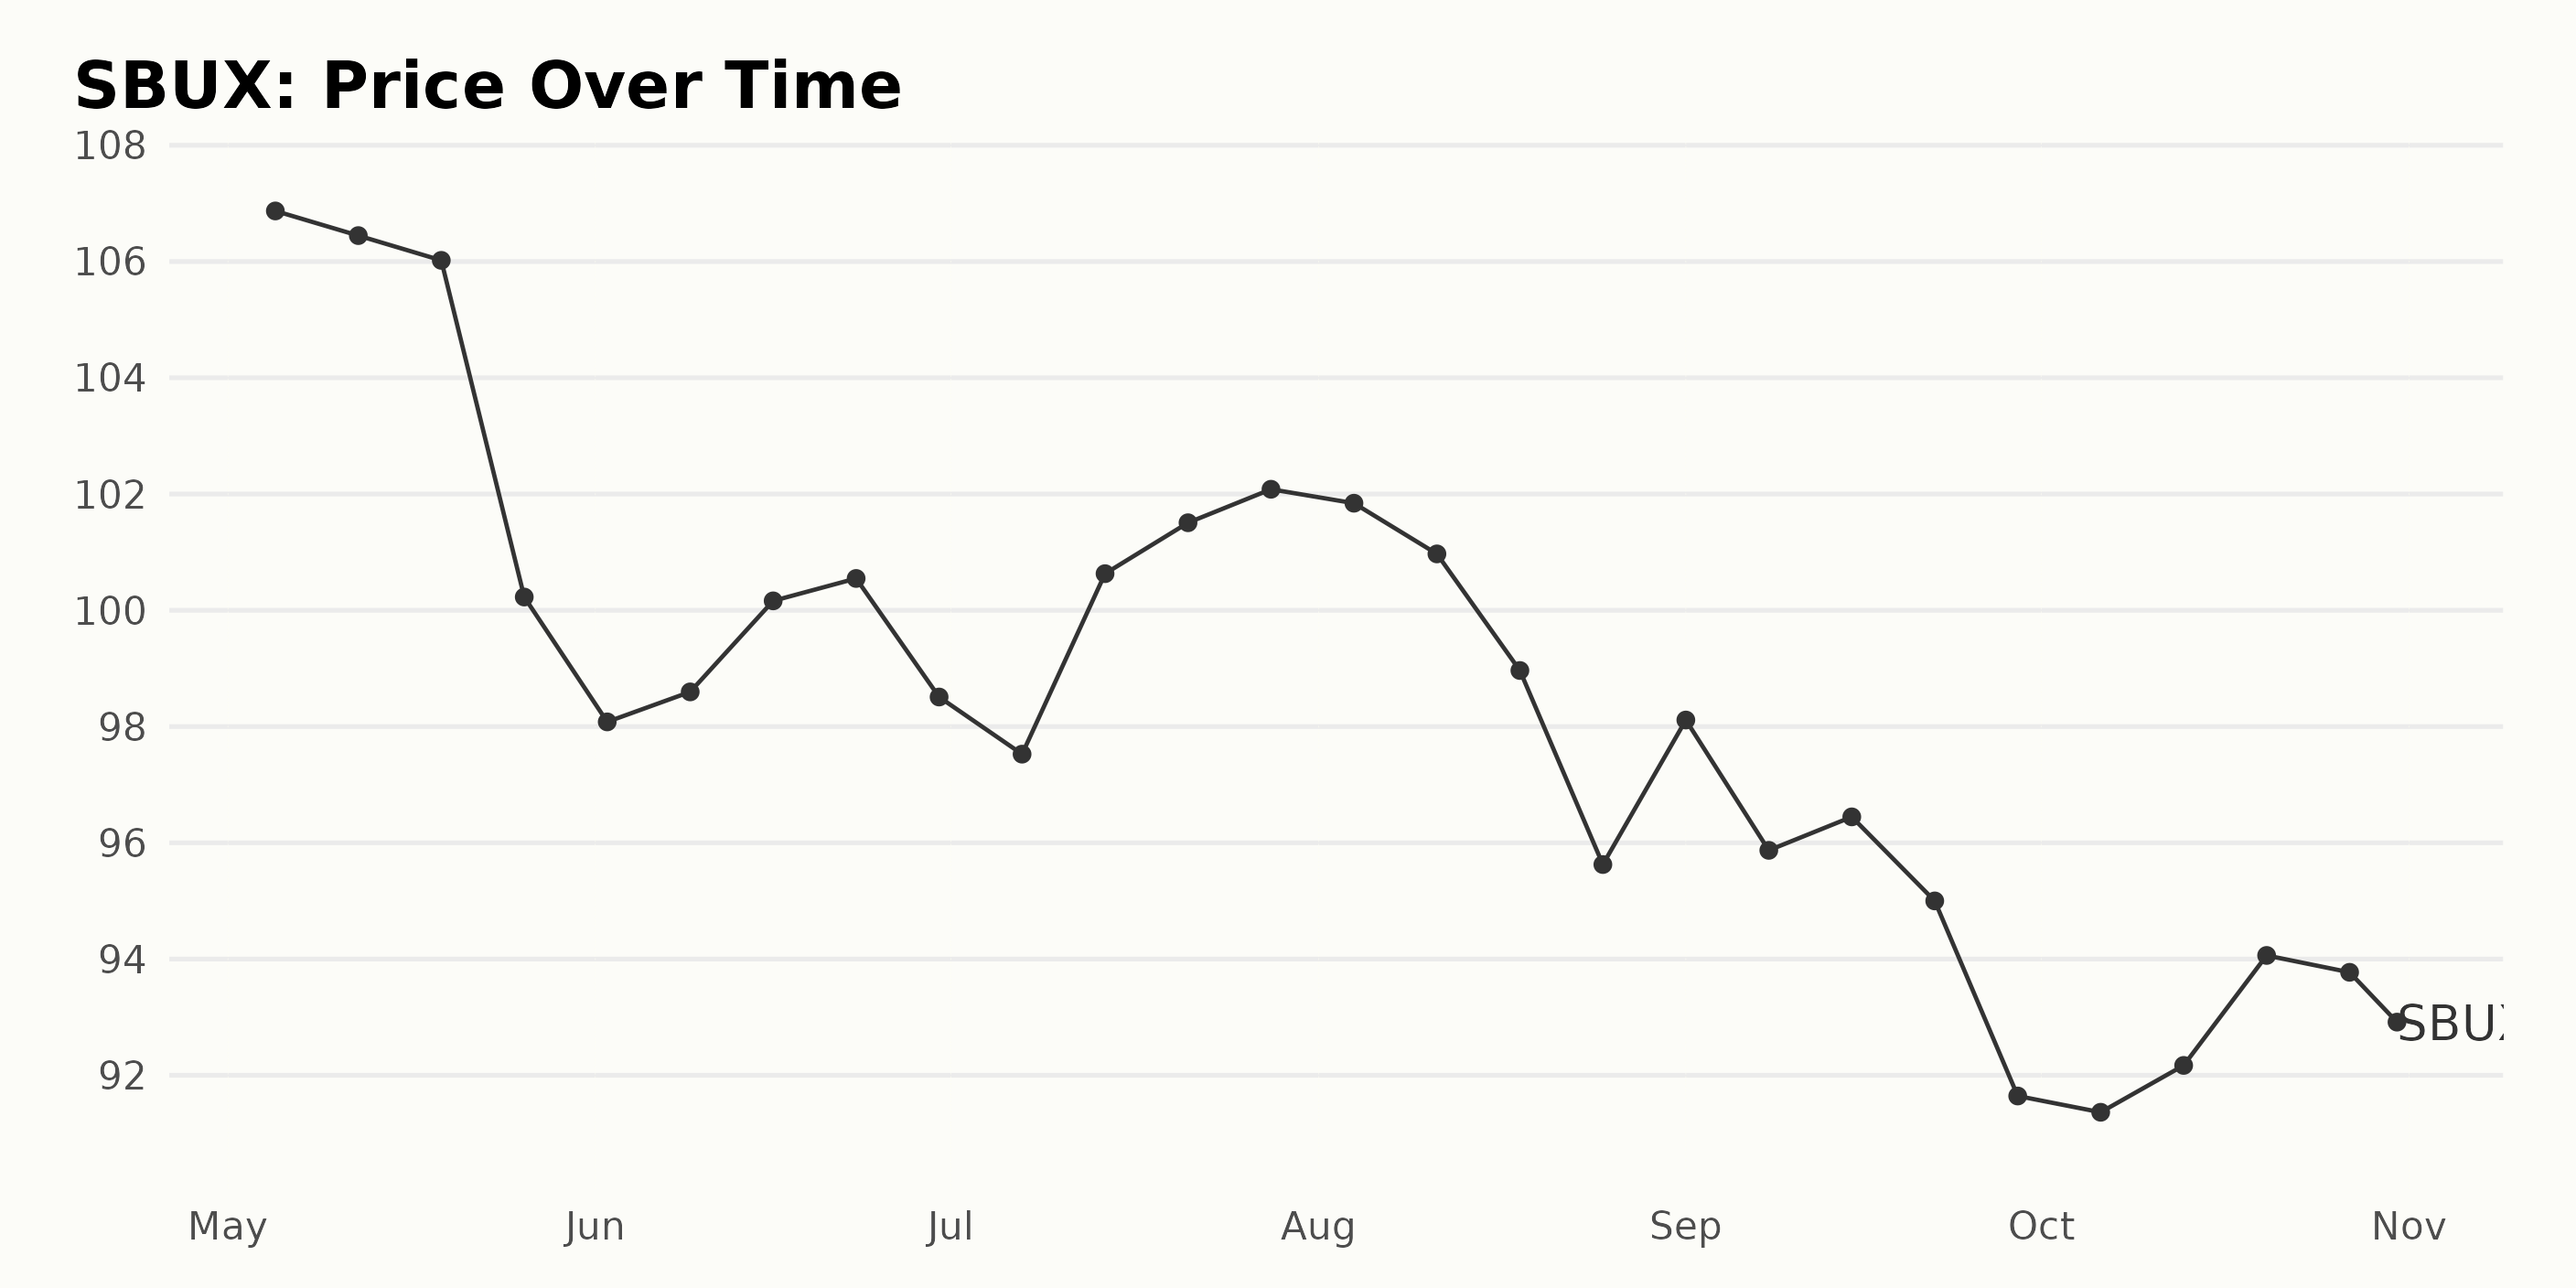
The share price data for SBUX from May to October 2023 shows a generally decreasing trend. The initial price on May 5, 2023, was $106.87, and the final price on October 31, 2023, was $92.24. Subtle fluctuations are noticed throughout this period. The trend can be split into three phases:
- Deceleration (May - June): The data reveals a palpable deceleration in price between May and June 2023. The value drops from the initial $106.87 to $98.08 before experiencing a slight increase in the mid-June.
- Stability (July - August): This leads to a period of relative stability during July and the larger part of August, with the price remaining around the $100 mark. It ranges from a low of $97.53 to a high of $102.08.
- Acceleration (August - October): Finally, there is an acceleration in the downward movement of the stock price from late August until October. The drop is pronounced as the value tumbles from $101.84 to $92.24.
Despite a brief recovery in late June and fluctuation in July and August, the general trend is a downward trajectory, with the SBUX stock losing about $14. Please note that the prices are subject to market risks and alterations. Here is a chart of SBUX's price over the past 180 days.
Starbucks Corporation: Quality, Momentum, and Sentiment POWR Ratings Evaluation
SBUX is classified under the Restaurants category of stocks, which consists of 45 individual stocks. Over a period of several months in the year 2023, SBUX held a POWR Ratings Grade of B (Buy) to C (Neutral), and its rank within its category fluctuated.
- During May 2023, SBUX maintained a POWR Grade of B (Buy) and fluctuated between rank positions #12 and #13.
- Through June 2023, SBUX kept a B (Buy) grade but experienced greater variability in its category rank, ranging from #12 to #20.
- The trend continued in July with POWR Grade B (Buy). However, its category rank started at #16 and ended at #15.
- For most of August 2023, SBUX kept its B (Buy) grade and improved significantly in rank, reaching as high as rank #10.
- Throughout September, SBUX's POWR Grade remained B (Buy), with its rank fluctuating slightly between #11 and #13.
- For the majority of October, SBUX performed well with a B (Buy) grade, maintaining its category rank at #10 and #11. However, on October 28, the POWR grade dropped to C (Neutral), with an increased rank of #13.
- By the end of October 2023, SBUX's POWR Grade was C (Neutral), and it stood at position #12 in its category ranking.
Currently, the latest POWR Grade for SBUX is C (Neutral), with a category rank of #13.
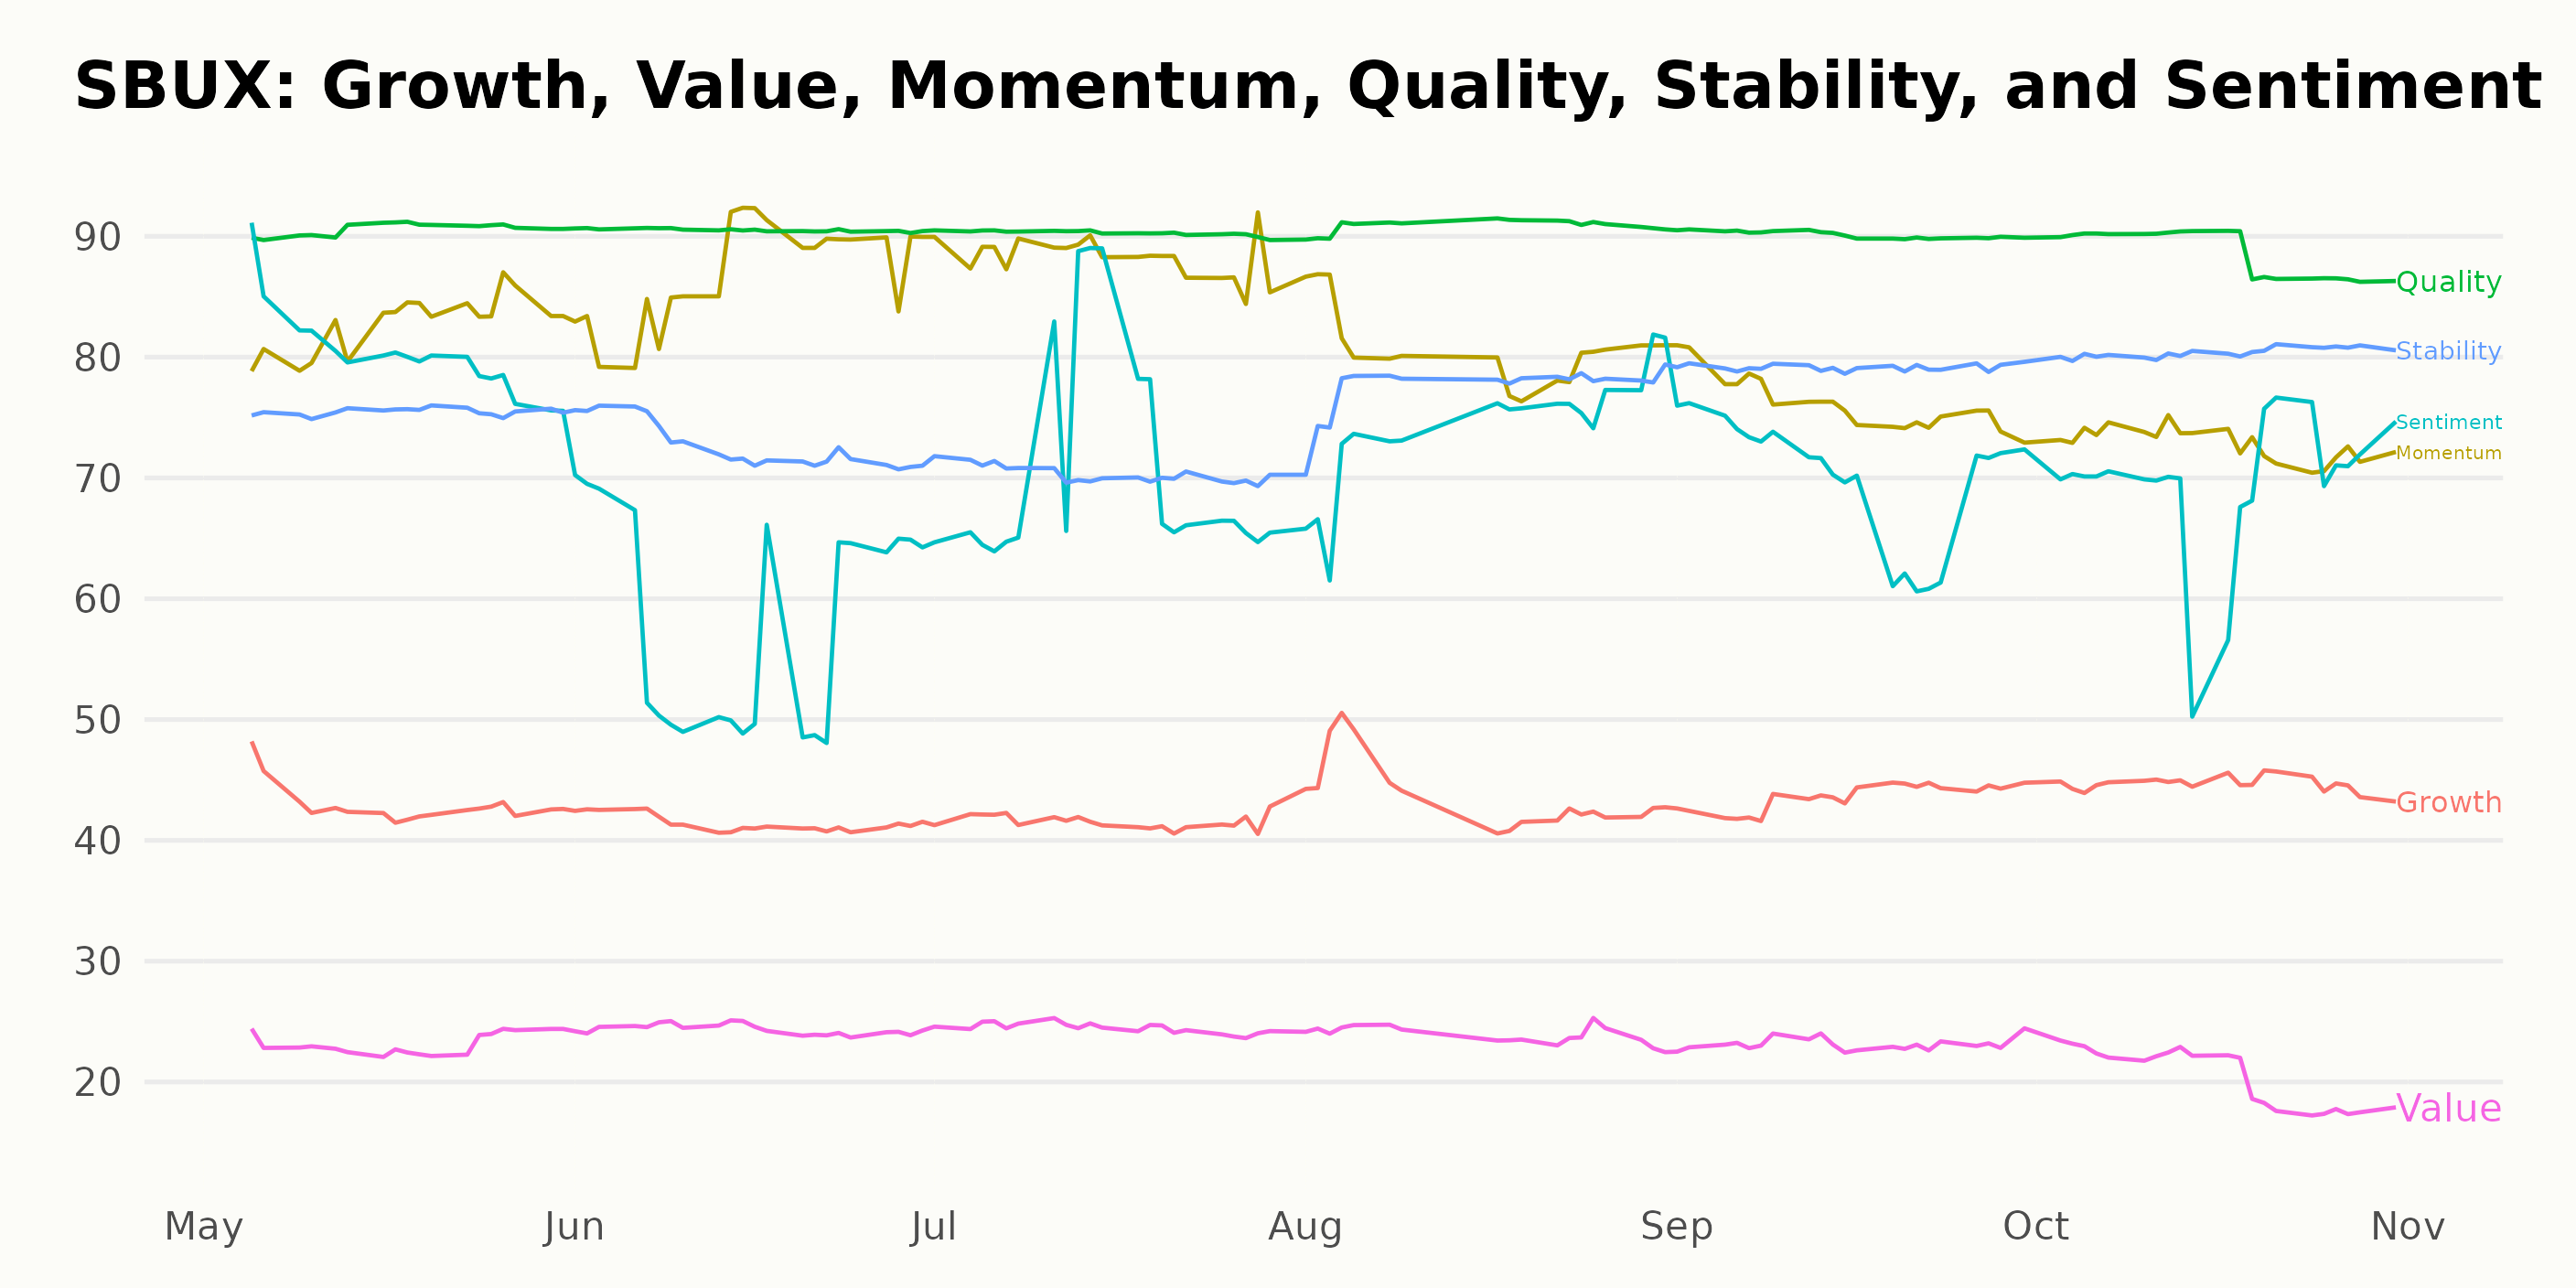
The three most noteworthy POWR Ratings for SBUX based on the data provided are Quality, Momentum, and Sentiment. These dimensions displayed the highest ratings across the specified time period.
Quality: The Quality dimension consistently had high ratings, ranging from 89 to 91. SBUX maintained an excellent quality score that never dipped below 89 between May 2023 and October 2023.
- In May 2023, the Quality rating stood at 91.
- This score remained consistent at 91 in June and August 2023 while slightly dipping to 90 in July and September of the same year.
- By October 2023, the Quality rating had lightly fluctuated but was still high at 89.
Momentum: The Momentum dimension showed a slight upward trend followed by a downward one.
- The Momentum rating began at a substantial 83 in May 2023.
- It experienced a sharp increase, reaching its peak of 88 in July 2023.
- However, subsequently, this figure began to decline, finishing at 73 in October 2023.
Sentiment: The Sentiment dimension exhibited an unstably increasing trend over time.
- In May 2023, the Sentiment rating was established at 80.
- It experienced a significant drop to 58 in June 2023 but later recovered, reaching a high of 74 in August 2023.
- Towards the end of the observed period, the sentiment score stabilized around 70 in October 2023.
In conclusion, SBUX had high ratings in Quality, while Momentum and Sentiment showed notable trends during the specified period.
How does Starbucks Corporation (SBUX) Stack Up Against its Peers?
Other stocks in the Restaurants sector that may be worth considering are Biglari Holdings Inc. (BH), Nathan's Famous, Inc. (NATH), and Domino's Pizza Group plc (DPUKY) - they have better POWR Ratings. Click here to explore more stocks in the Restaurants sector.
What To Do Next?
Get your hands on this special report with 3 low priced companies with tremendous upside potential even in today’s volatile markets:
3 Stocks to DOUBLE This Year >
SBUX shares were trading at $90.89 per share on Wednesday afternoon, down $1.35 (-1.46%). Year-to-date, SBUX has declined -6.97%, versus a 10.94% rise in the benchmark S&P 500 index during the same period.
About the Author: Anushka Dutta

Anushka is an analyst whose interest in understanding the impact of broader economic changes on financial markets motivated her to pursue a career in investment research.
The post Starbucks (SBUX) Earnings Preview - Buy or Sell? appeared first on StockNews.com