


Leading entertainment company AMC Entertainment Holdings, Inc. (AMC) recently carried out a 10:1 reverse stock split, a move that often indicates financial distress. This consolidation of shares, reducing their number while increasing their individual price, comes ahead of the conversion of Preferred Equity Units (APE) into common shares.
Despite an initial opening price of $19.60 after the reverse split, AMC's stock closed at $14.42, marking a significant decline of 26%. This move to align APE units with common shares is an attempt to prevent arbitrage trading, but it raises concerns about AMC's financial stability.
Moreover, CEO Adam Aron had issued stark warnings to retail investors who oppose the APE-to-stock conversion, suggesting that AMC might be on the brink of bankruptcy without access to new capital.
In addition, when considering debt, AMC's corporate borrowings and other long-term obligations came in at an alarming $4.82 billion and $101.9 million, respectively, during the fiscal second quarter.
Despite the financial maelstrom, AMC plans to showcase the box-office record-breaking concert film 'TAYLOR SWIFT | THE ERAS TOUR' at several theaters across Canada, Mexico, and the United States, commencing on October 13.
That being said, evaluating AMC's key financial metrics and market trends paints a rather gloomy picture, making it advisable to steer clear of this stock for the moment.
AMC’s Financial Performance: Analyzing Net Income, P/E Ratio, P/S Ratio, and Current Ratio:
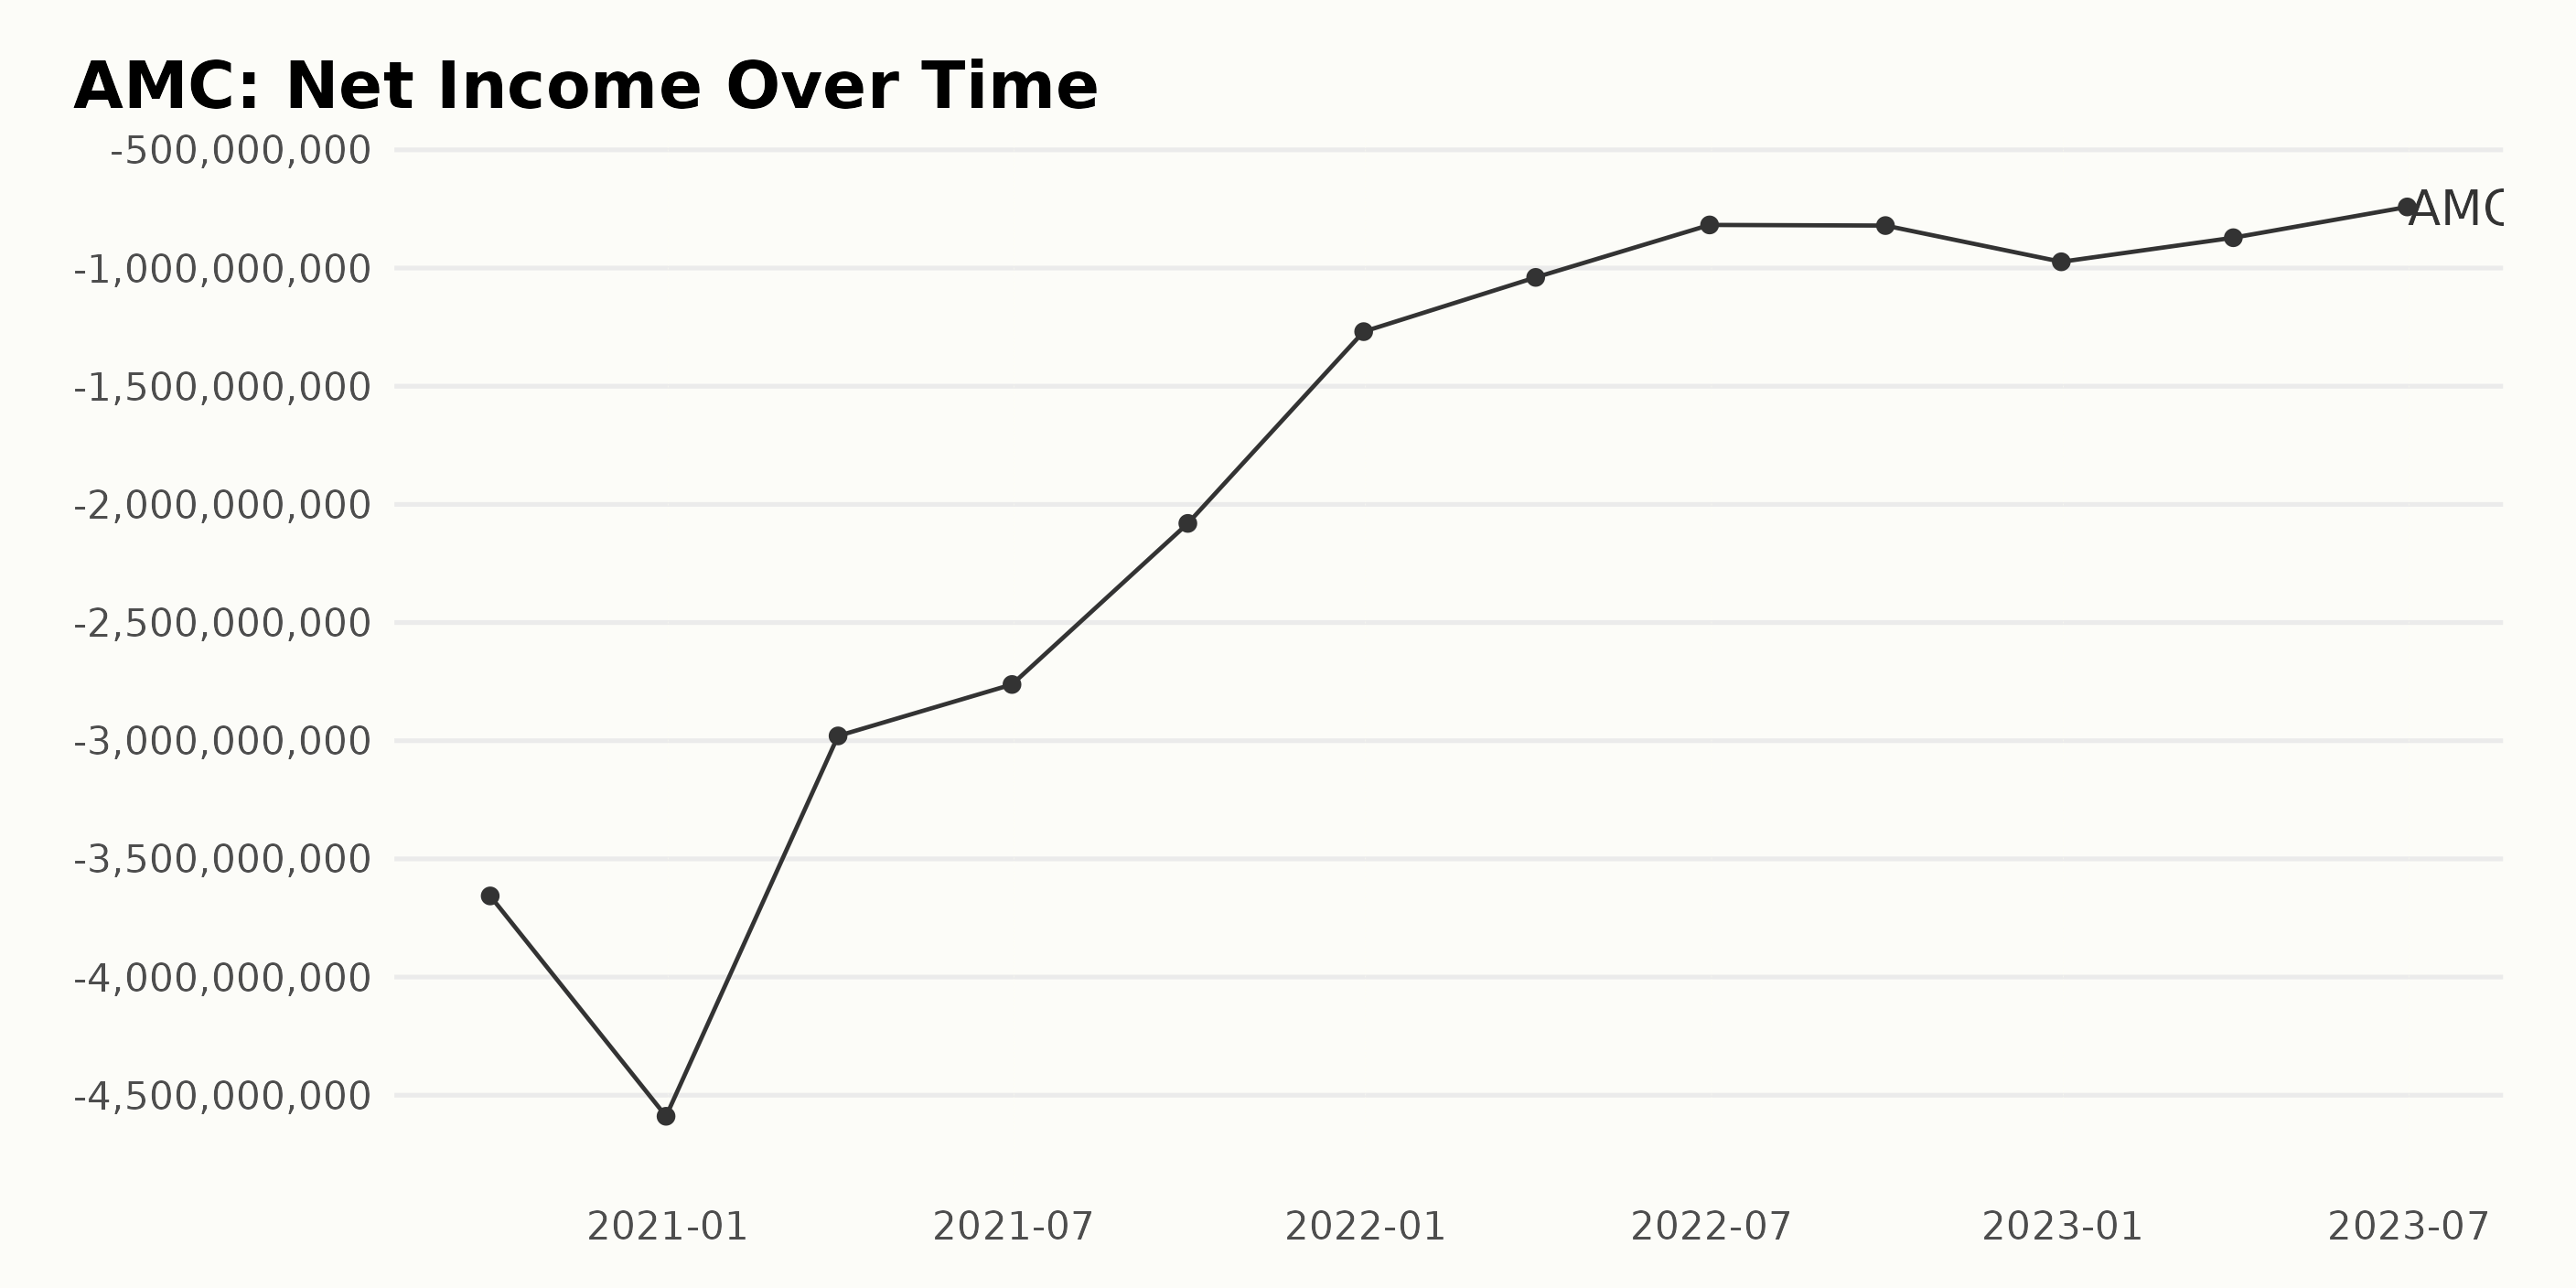
The trend in AMC’s trailing-12-month net income shows a sustained decrease in losses over the selected period. The fluctuations indicate a path marked by both reductions and increases but with a predominant sketch towards improvement. Here's a summary of its data set:
- As of September 30, 2020, AMC posted a net loss of $3.66 billion.
- Losses peaked in December 2020 at $4.59 billion.
- The next significant date is March 31, 2021, when losses decreased to $2.98 billion.
- The company saw its net income improve consistently until it reached -$2.08 billion on September 30, 2021.
- Despite a slight increase in losses in December 2021, they have generally been reducing, hitting -$973.60 million by December 31, 2022.
- By the more recent date of June 30, 2023, it again saw an encouraging improvement, with losses reduced to $-741.50 million.
Generally, AMC has displayed a steady yet oscillating trajectory toward lowering its net income losses over these years. By calculating the growth rate from the last value (-$741.50 million) against the first value (-$3.66 billion), there is a substantial reduction of approximately 79.74%, indicating improved financial stability for AMC over this period. However, the recurring fluctuations suggest elements of volatility for which potential investors should be aware.
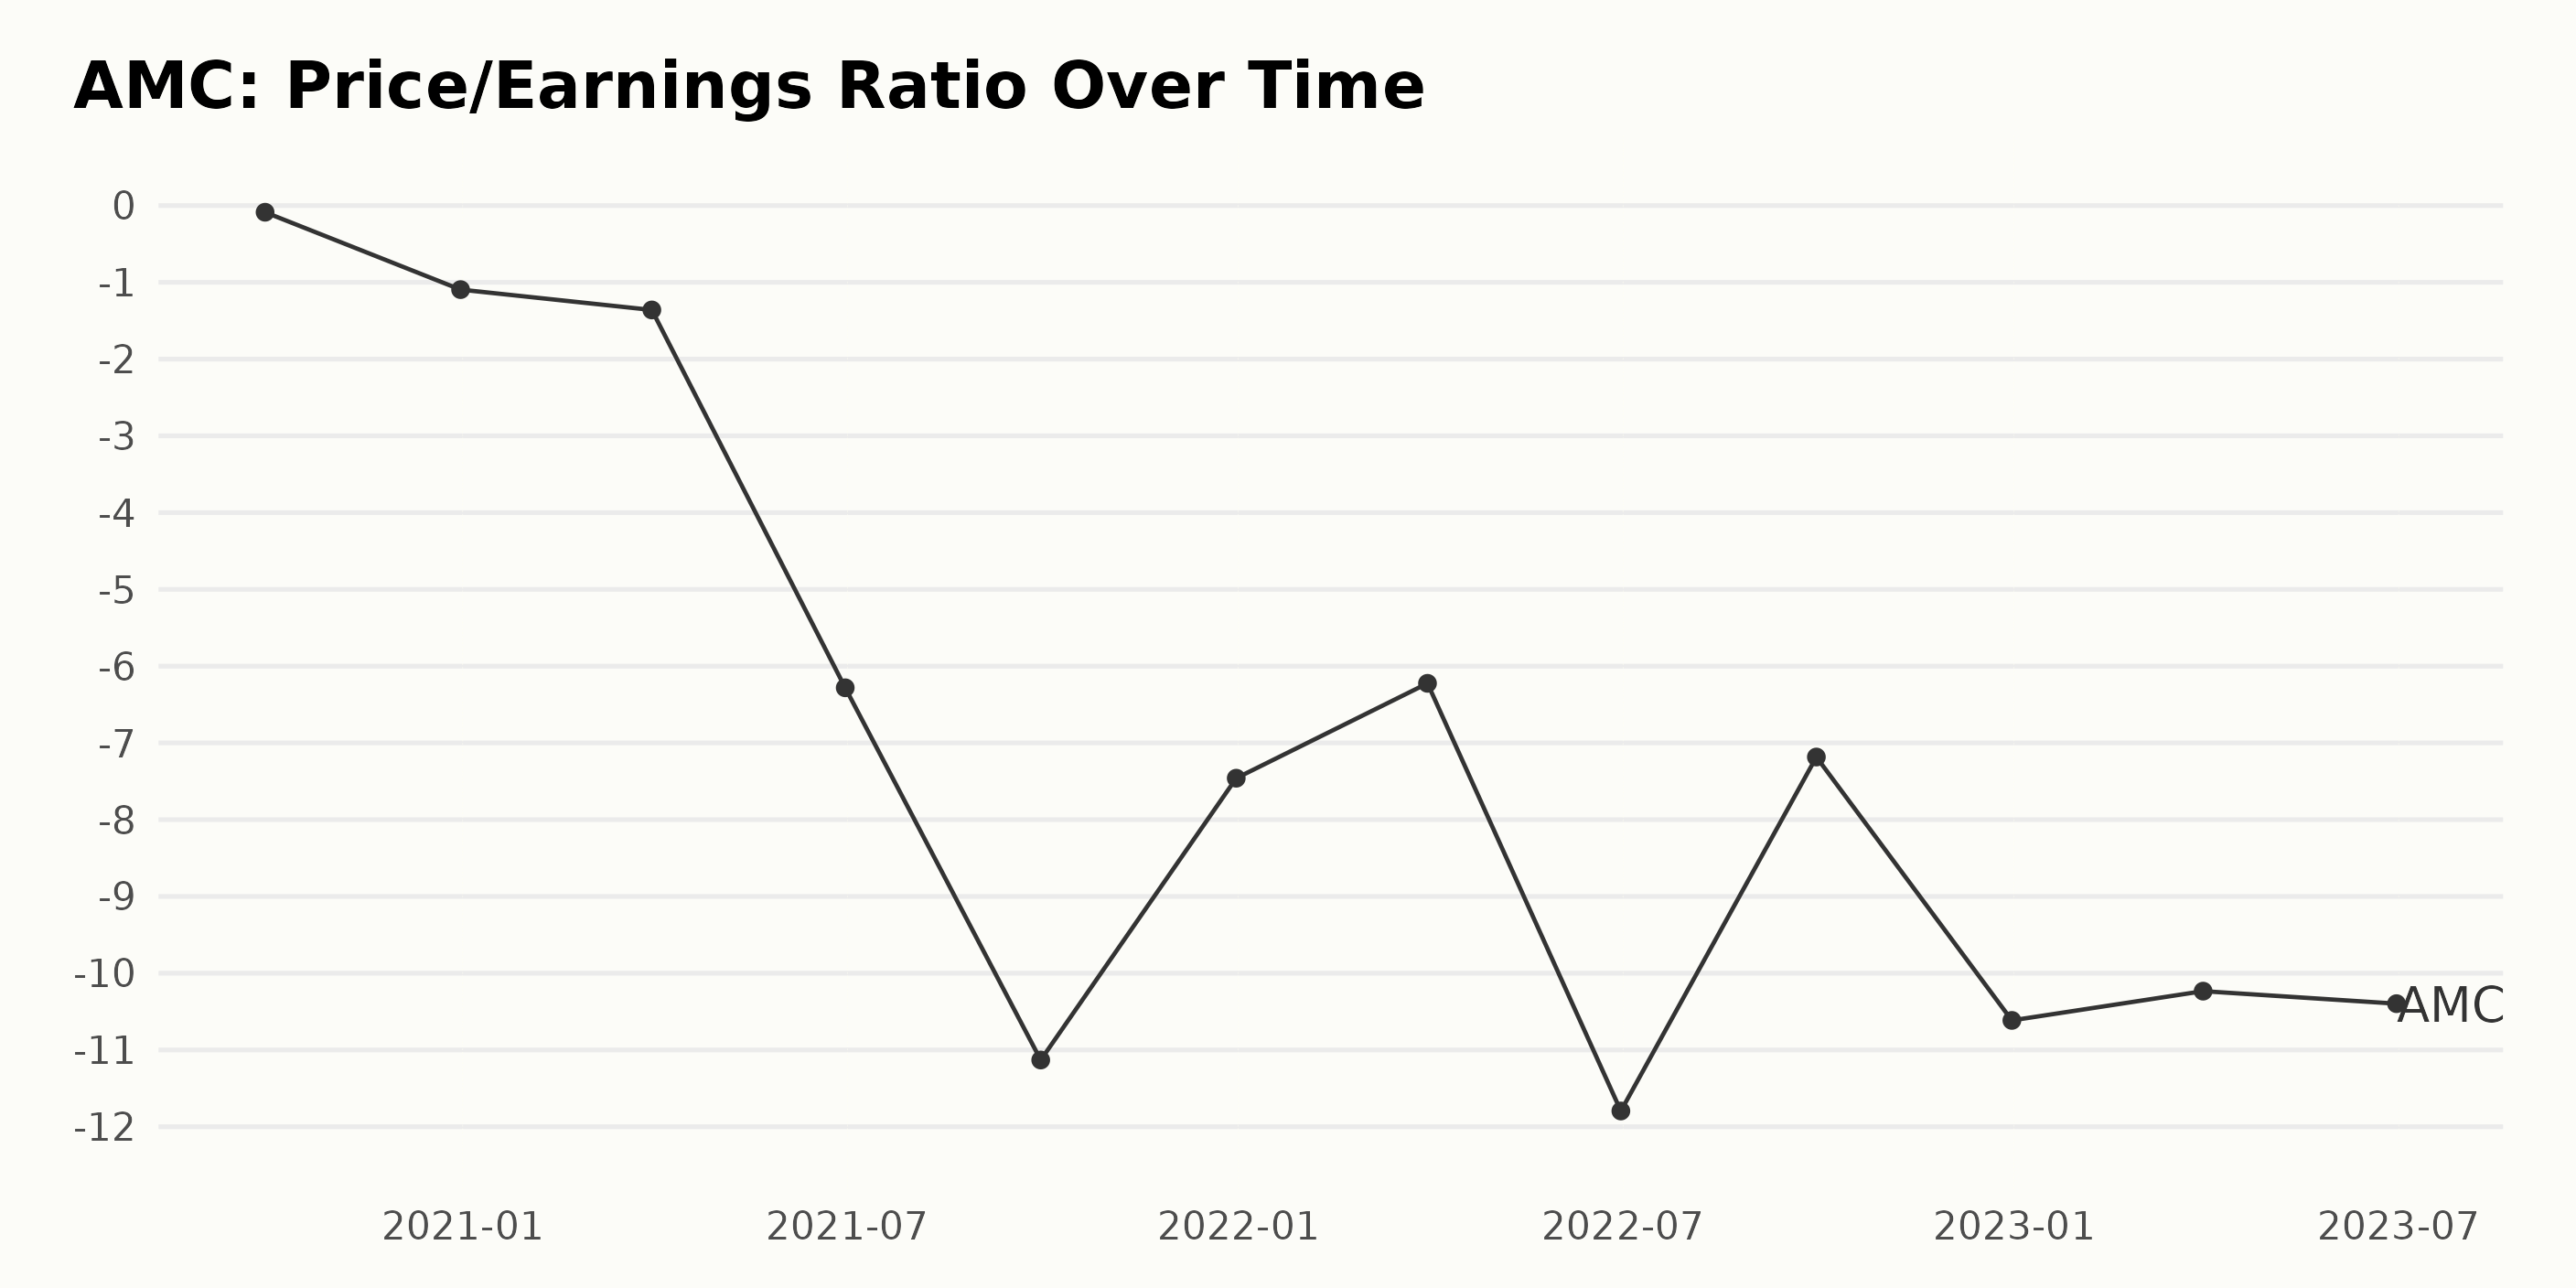
The Price/Earnings Ratio (P/E) of AMC has shown a downward trend with noticeable fluctuations from September 2020 to June 2023:
- In September 2020, the P/E was -0.087.
- By December 2020, it decreased sharply by over 10x to -1.095.
- Continuing its decline, it fell to -1.36 in the first quarter of 2021, then plummeted to -6.282 in the second quarter, and further still to -11.131 by the end of third quarter.
- Interestingly, in the fourth quarter of 2021, the P/E saw a significant rebound, coming back up to -7.46; however, this respite was temporary, and the P/E fell to -6.224 in the first quarter of 2022.
- The second quarter of 2022 saw the P/E once again undergo a steep fall to -11.795, and despite a slight recovery to -7.184 in the third quarter, by year-end, the P/E became even more negative at -10.615.
- Finally, in the first half of 2023, the P/E exhibited little change, recording -10.234 and -10.397 for the first quarter and second quarter, respectively.
Although there were visible oscillations throughout this period, the overall trend was a progressive decrease in the P/E ratio, indicating a depreciation in AMC's profitability relative to its earnings. Notably, the value in June 2023 was much lower than in September 2020, a negative growth of approximately 11957% over the period assessed.
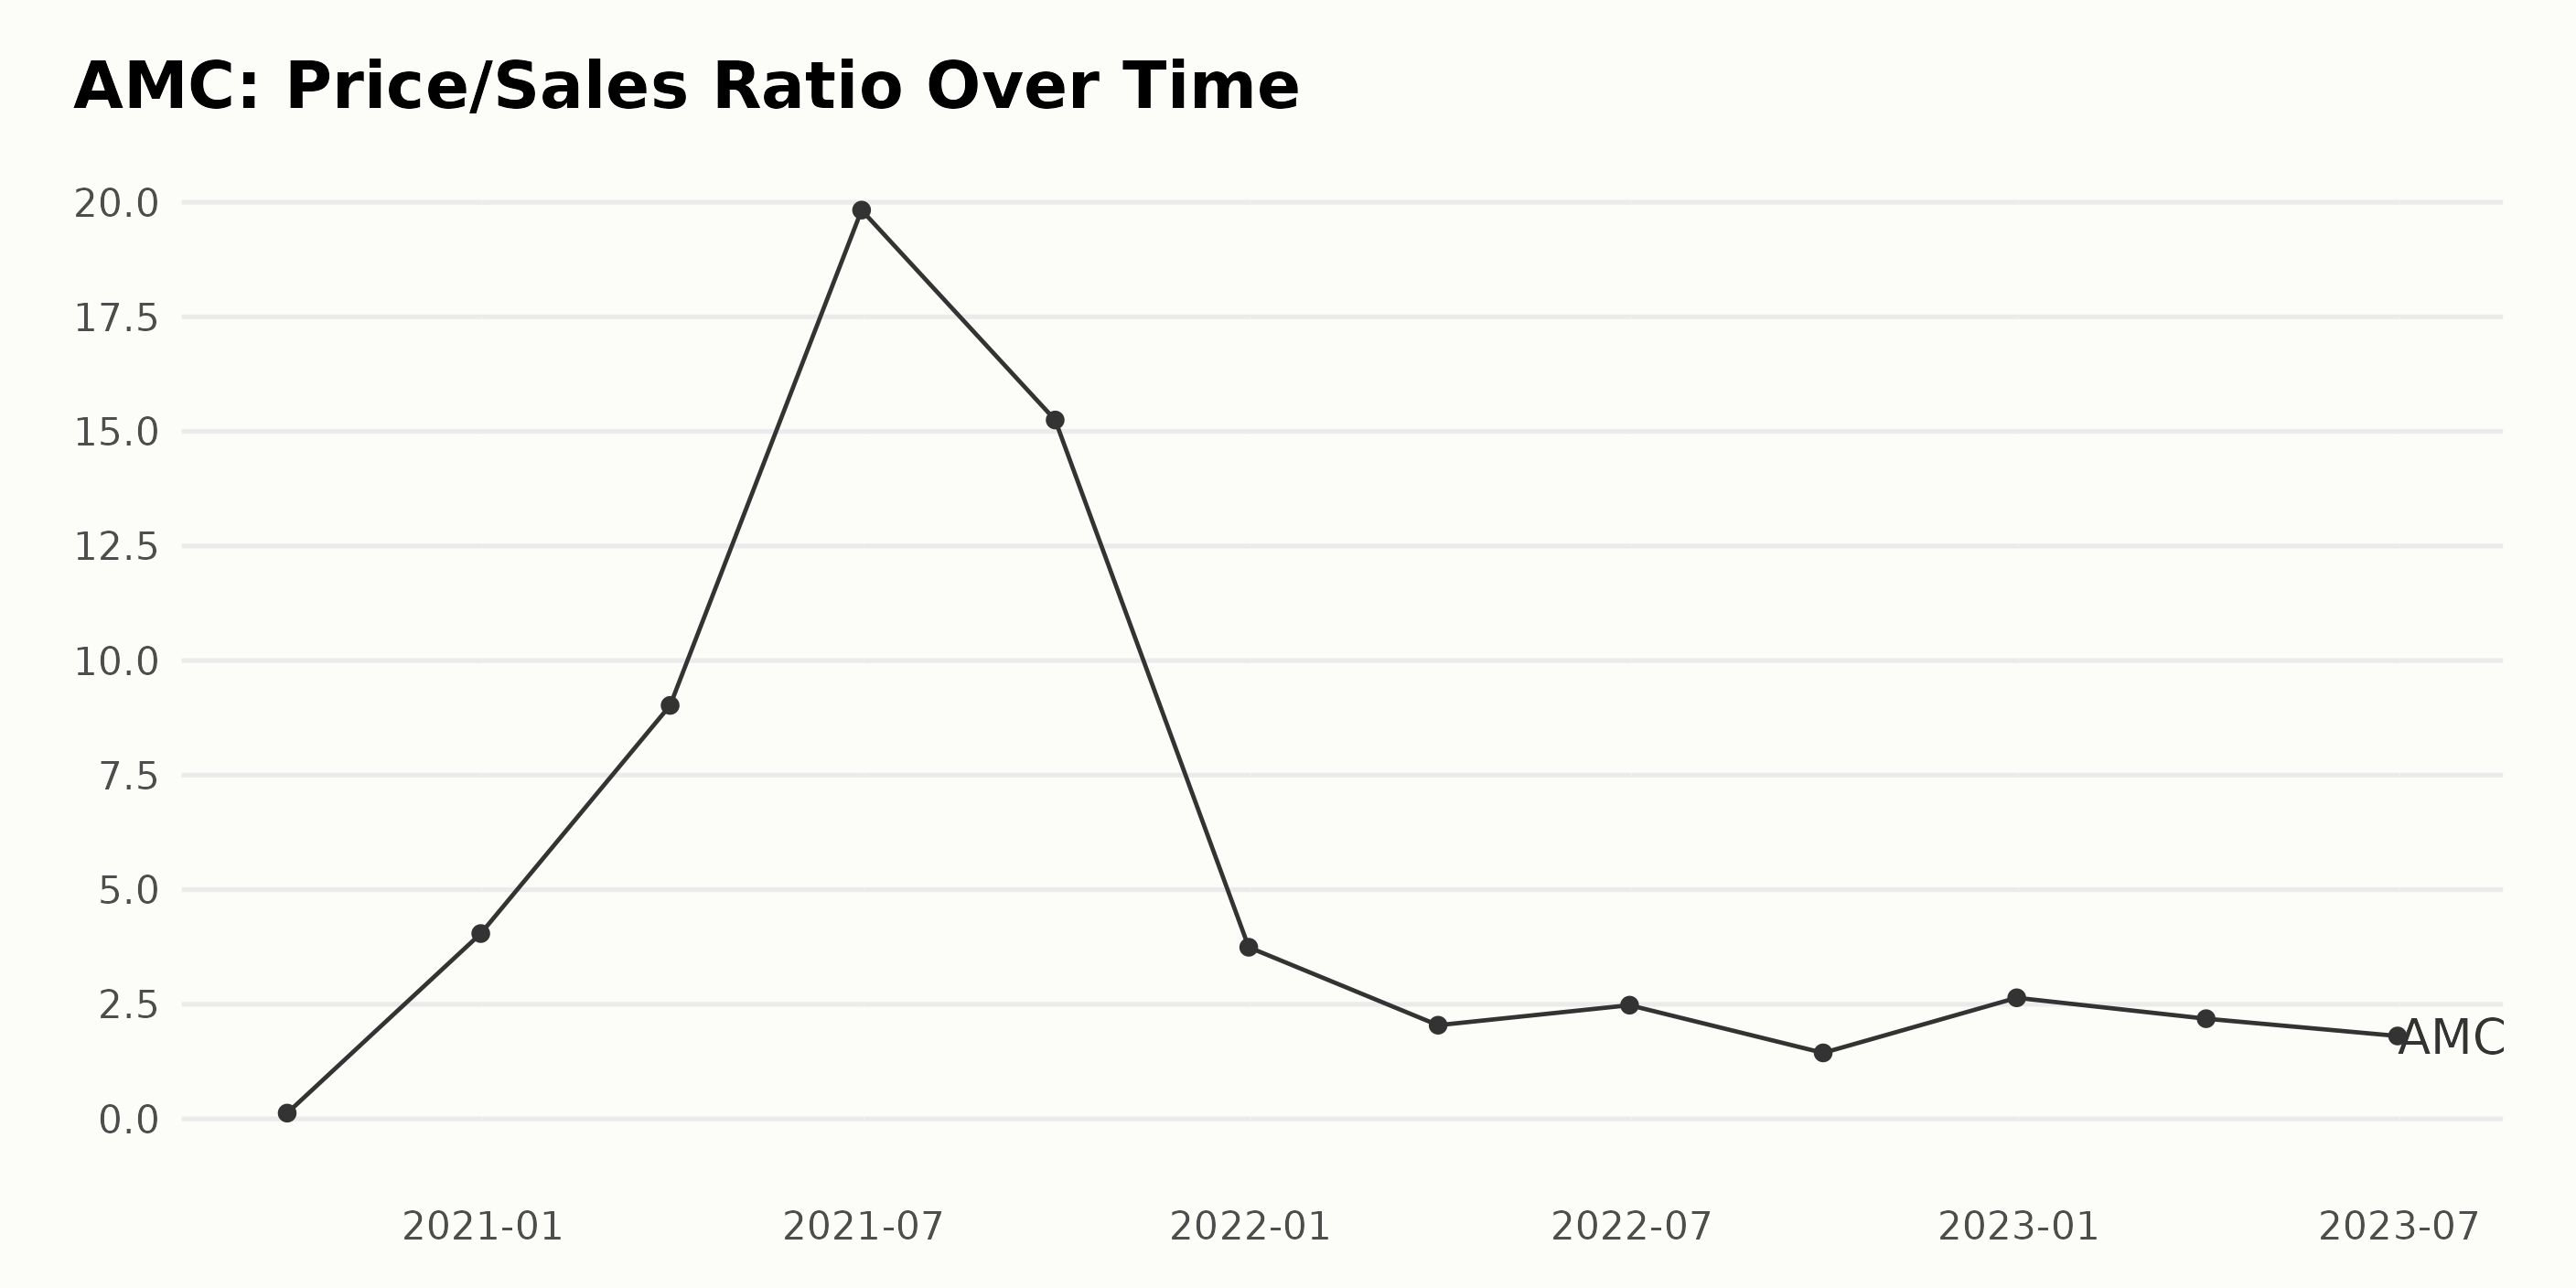
The Price/Sales Ratio (P/S) of AMC indicates an overall downfall trend despite minor fluctuations over the given time span from September 2020 to June 2023.
- In September 2020, the P/S was at 0.126.
- By December 2020, there was a remarkable increase to a P/S of 4.044.
- After that, we saw substantial growth, peaking at a P/S of 19.829 in June 2021.
- After this growth, it began declining to reach a P/S of 15.25 by September 2021.
- The downward trend continued to a P/S of 2.044 by March 2022, indicating considerable shrinkage.
- There was a slight increase to 2.642 in December 2022, reflecting a modest recovery before it fell again to 1.809 in June 2023.
Reviewing this data, there are notable fluctuations with significant peaks and troughs. However, the overriding trend from September 2020 to June 2023 is a tapering decline in AMC's P/S. Over these almost three years, the P/S has reduced by about 93% (from 19.8 down to 1.8). Yet, the most recent figure in June 2023 is still considerably higher (+1300%) than the very first value (0.126 in September 2020). This shows that despite recent fallbacks, the growth from the beginning of the observed period remains extremely positive.
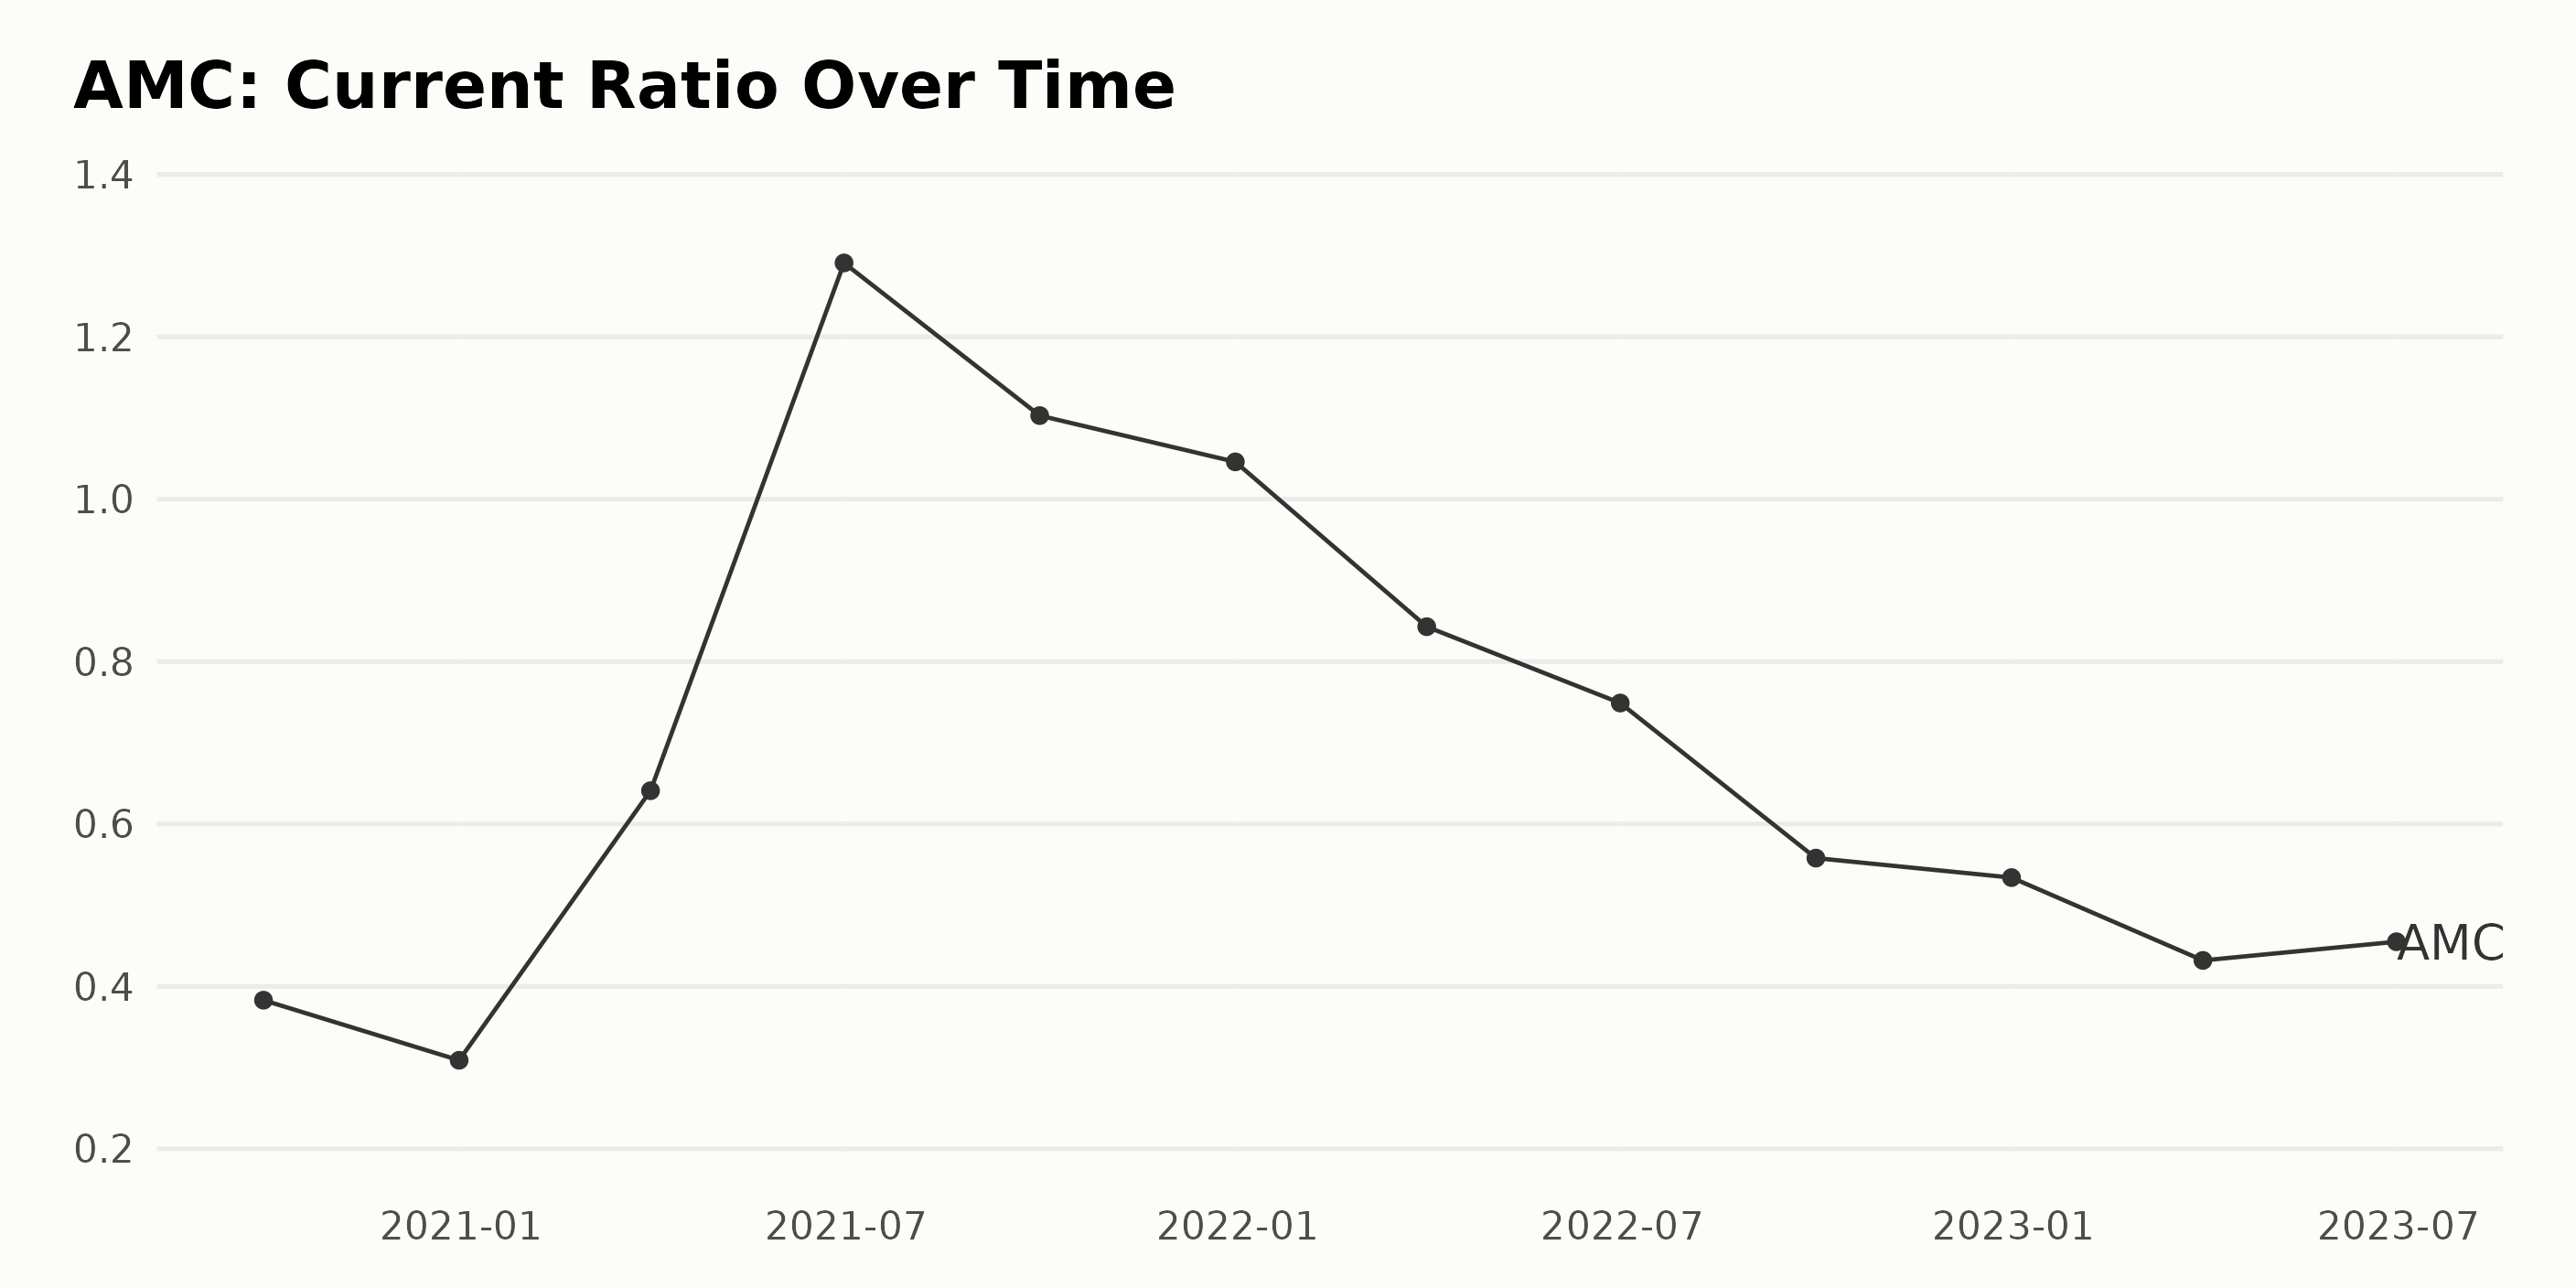
The series of data chronicles the Current Ratio (CR) of AMC over a period from September 2020 to June 2023. A clear visualization of this data reveals certain fluctuations and an overarching trend. The details are as follows:
- At the start of the period on September 30, 2020, the CR was 0.38.
- The CR dipped to 0.31 by the end of December 2020.
- In March 2021, there was a significant rise to 0.64, which further soared to its peak at 1.29 by June 2021.
- A gradual decline was observed after this point; dropping to 1.10 by September 2021 and 1.05 by December 2021.
- The CR continued to fall during 2022, reducing to 0.84 in March, 0.75 in June, and as low as 0.56 by September. It registered a slight drop to 0.53 by the end of 2022.
- For the given period in 2023, a further decrease to 0.43 was reported in March; however, there was a slight rise to 0.46 by June 2023.
Notably, there has been a decrease in the CR from the initial value of 0.38 to the last recorded value of 0.46, representing negative growth. The most considerable rise was experienced in the first half of 2021, followed by a consistent decline thereafter. Thus, though there were intermittent rises, the general trend in AMC’s CR is a declining one. More recently, the trend has not shown any significant improvement, with data from the last year reflecting a downward trajectory.
Analysis of AMC Entertainment's Share Price Fluctuations: March to August 2023
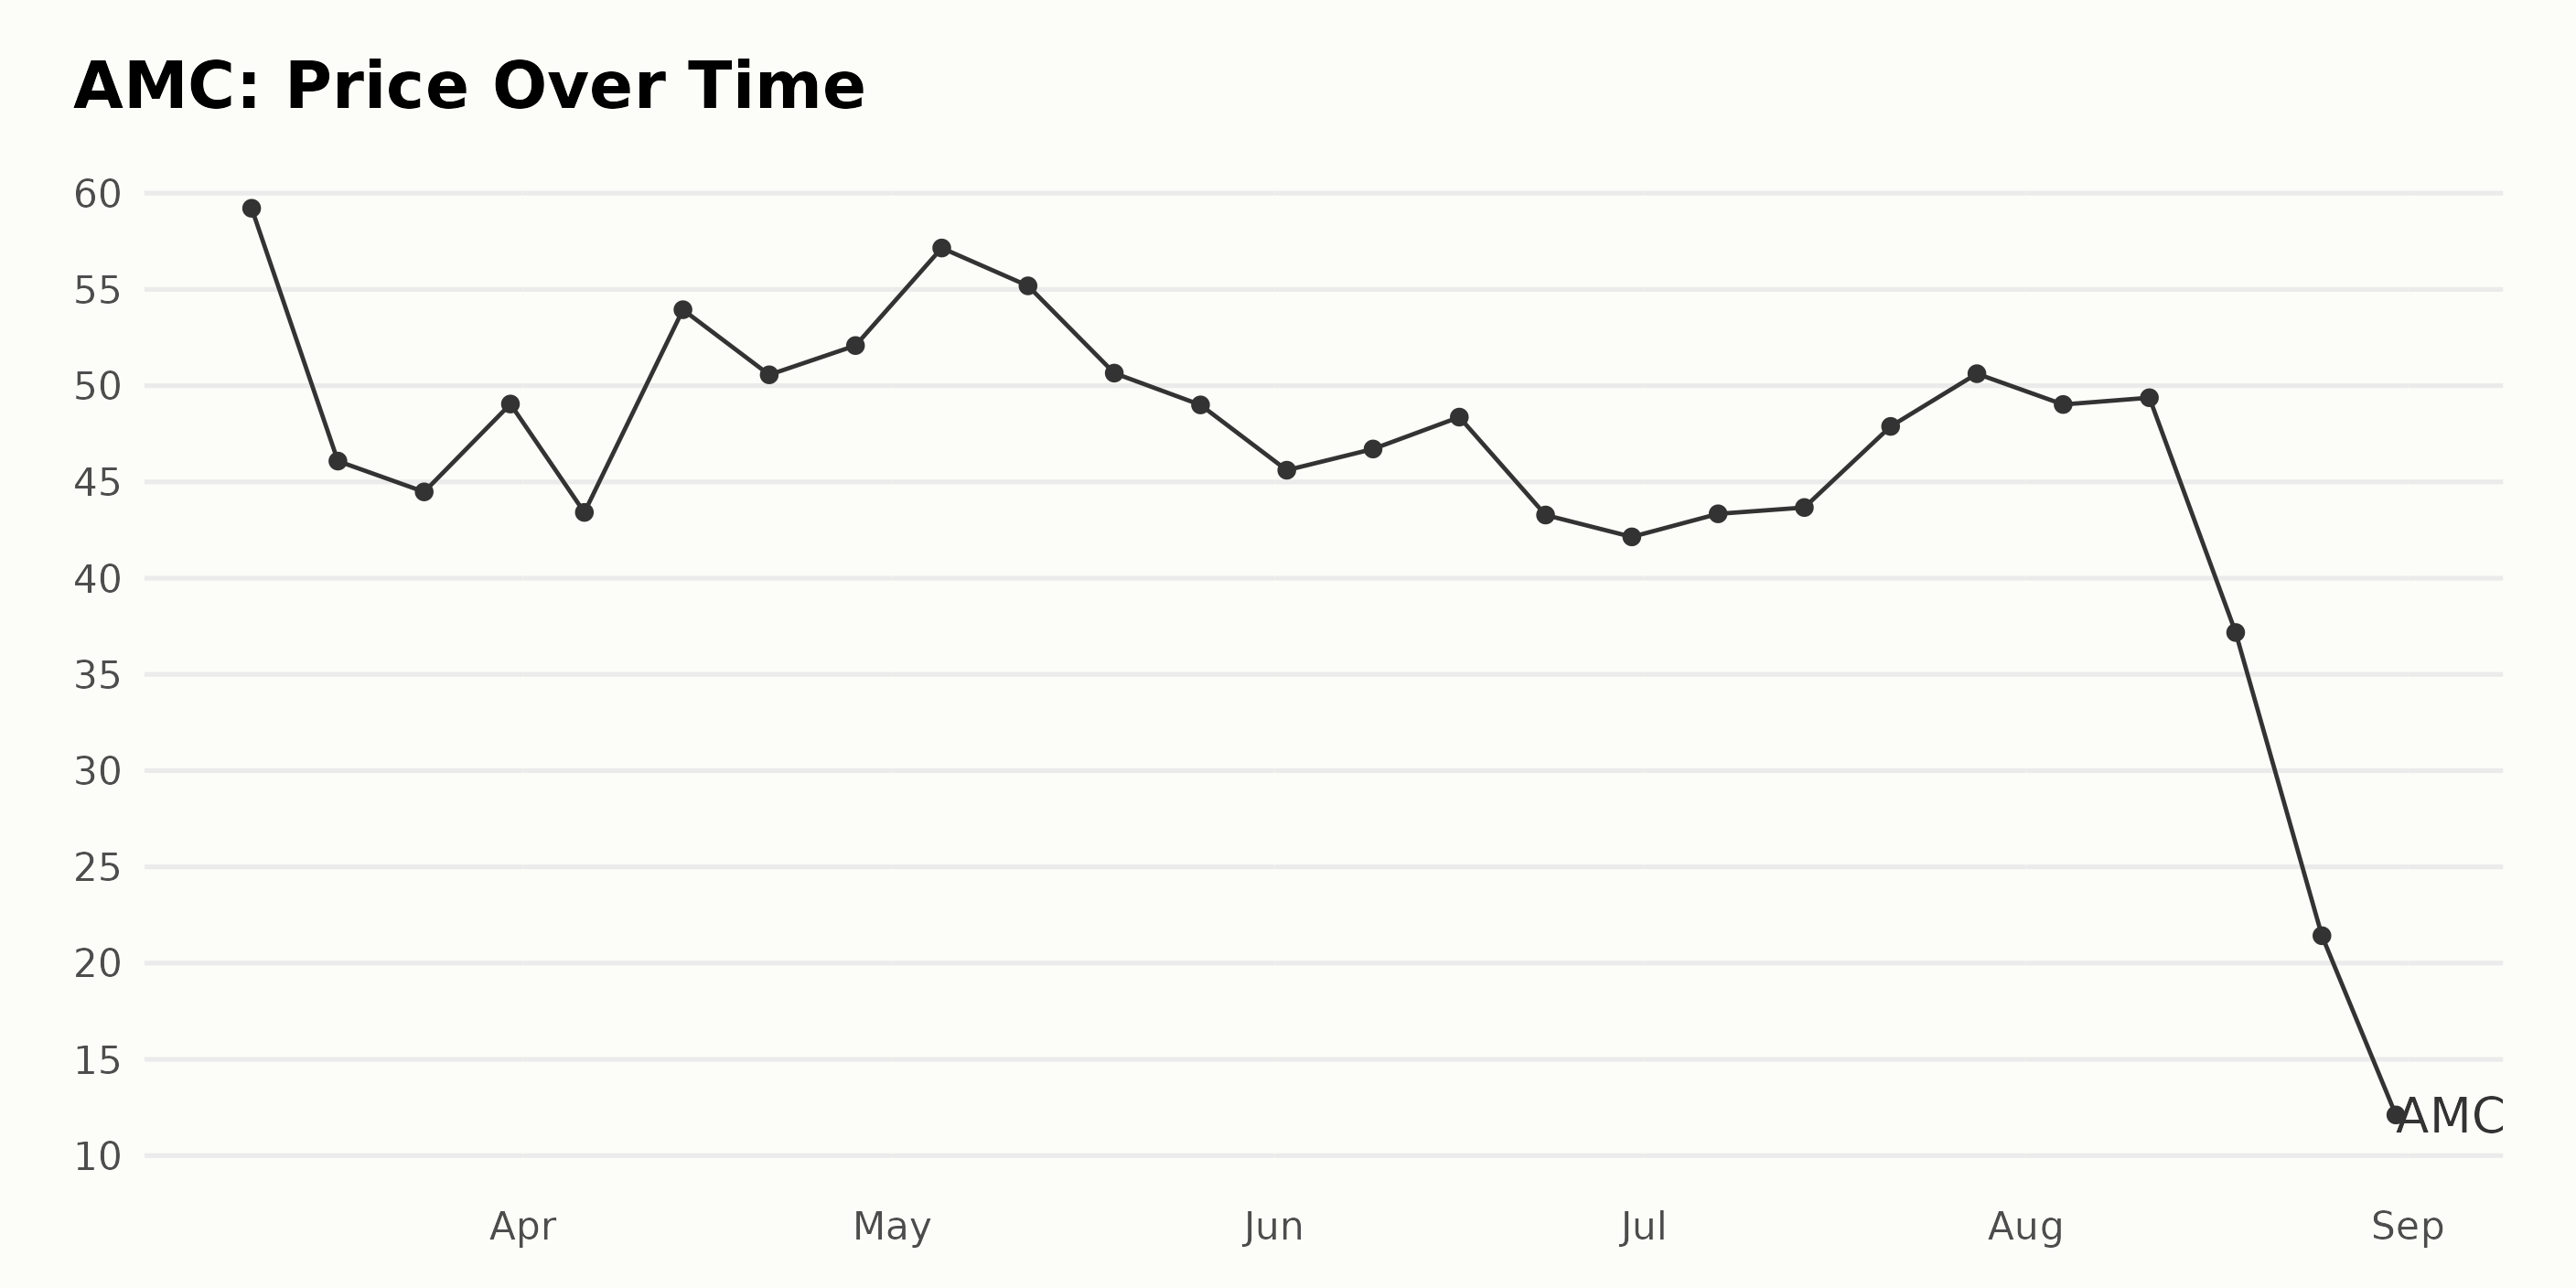
The given data outlines AMC’s share price from March 2023 to August 2023.
- In March 2023, the stock price began at around $59.22 and ended the month at around $49.05. This shows a decline, with the share price experiencing volatility during that period.
- In April 2023, the stock started at about $43.42 and concluded at nearly $52.08. The price underwent fluctuations, but there was overall growth.
- In May 2023, it started at approximately $57.15 and wrapped up at roughly $49.00. It illustrated a downfall in this month compared with April 2023.
- Examining June 2023, the figures highlight a start of about $45.61 and end at near $42.14. The prices continued to show a downtrend.
- In July 2023, AMC's share price launched at $43.34 and closed at $50.62, indicating a rise compared to the previous month.
- In the last month of the dataset, August 2023, the stocks took a sharp dive. Kickstarting at $49.02, it rapidly decreased to approximately $12.11 by the end of the month – a striking drop in value.
Overall, AMC showed a significant downward trend from March to August 2023. While there were instances of short-term growth, the long-term trajectory reveals a steep downturn, particularly in August 2023.
This suggests a deceleration in the asset's performance over the considered time frame. Here is a chart of AMC's price over the past 180 days.
Assessing AMC's Performance: Insights from Growth, Momentum, and Value Ratings
AMC has an overall D rating, translating to a Sell in our POWR Ratings system. Among the six stocks in the Entertainment - Movies/Studios category, AMC is ranked last.
AMC has seen its POWR Grade fluctuate over the course of several months in 2023. In the span from March 11, 2023, to August 31, 2023, AMC's POWR Ratings have consistently been 'D'. Within this same period, AMC's rank in its category varied between 5 and 6, indicating a relative position towards the lower end of the spectrum within the Entertainment - Movies/Studios category. These data points provide significant insight into AMC's performance and positioning within the stock market landscape.
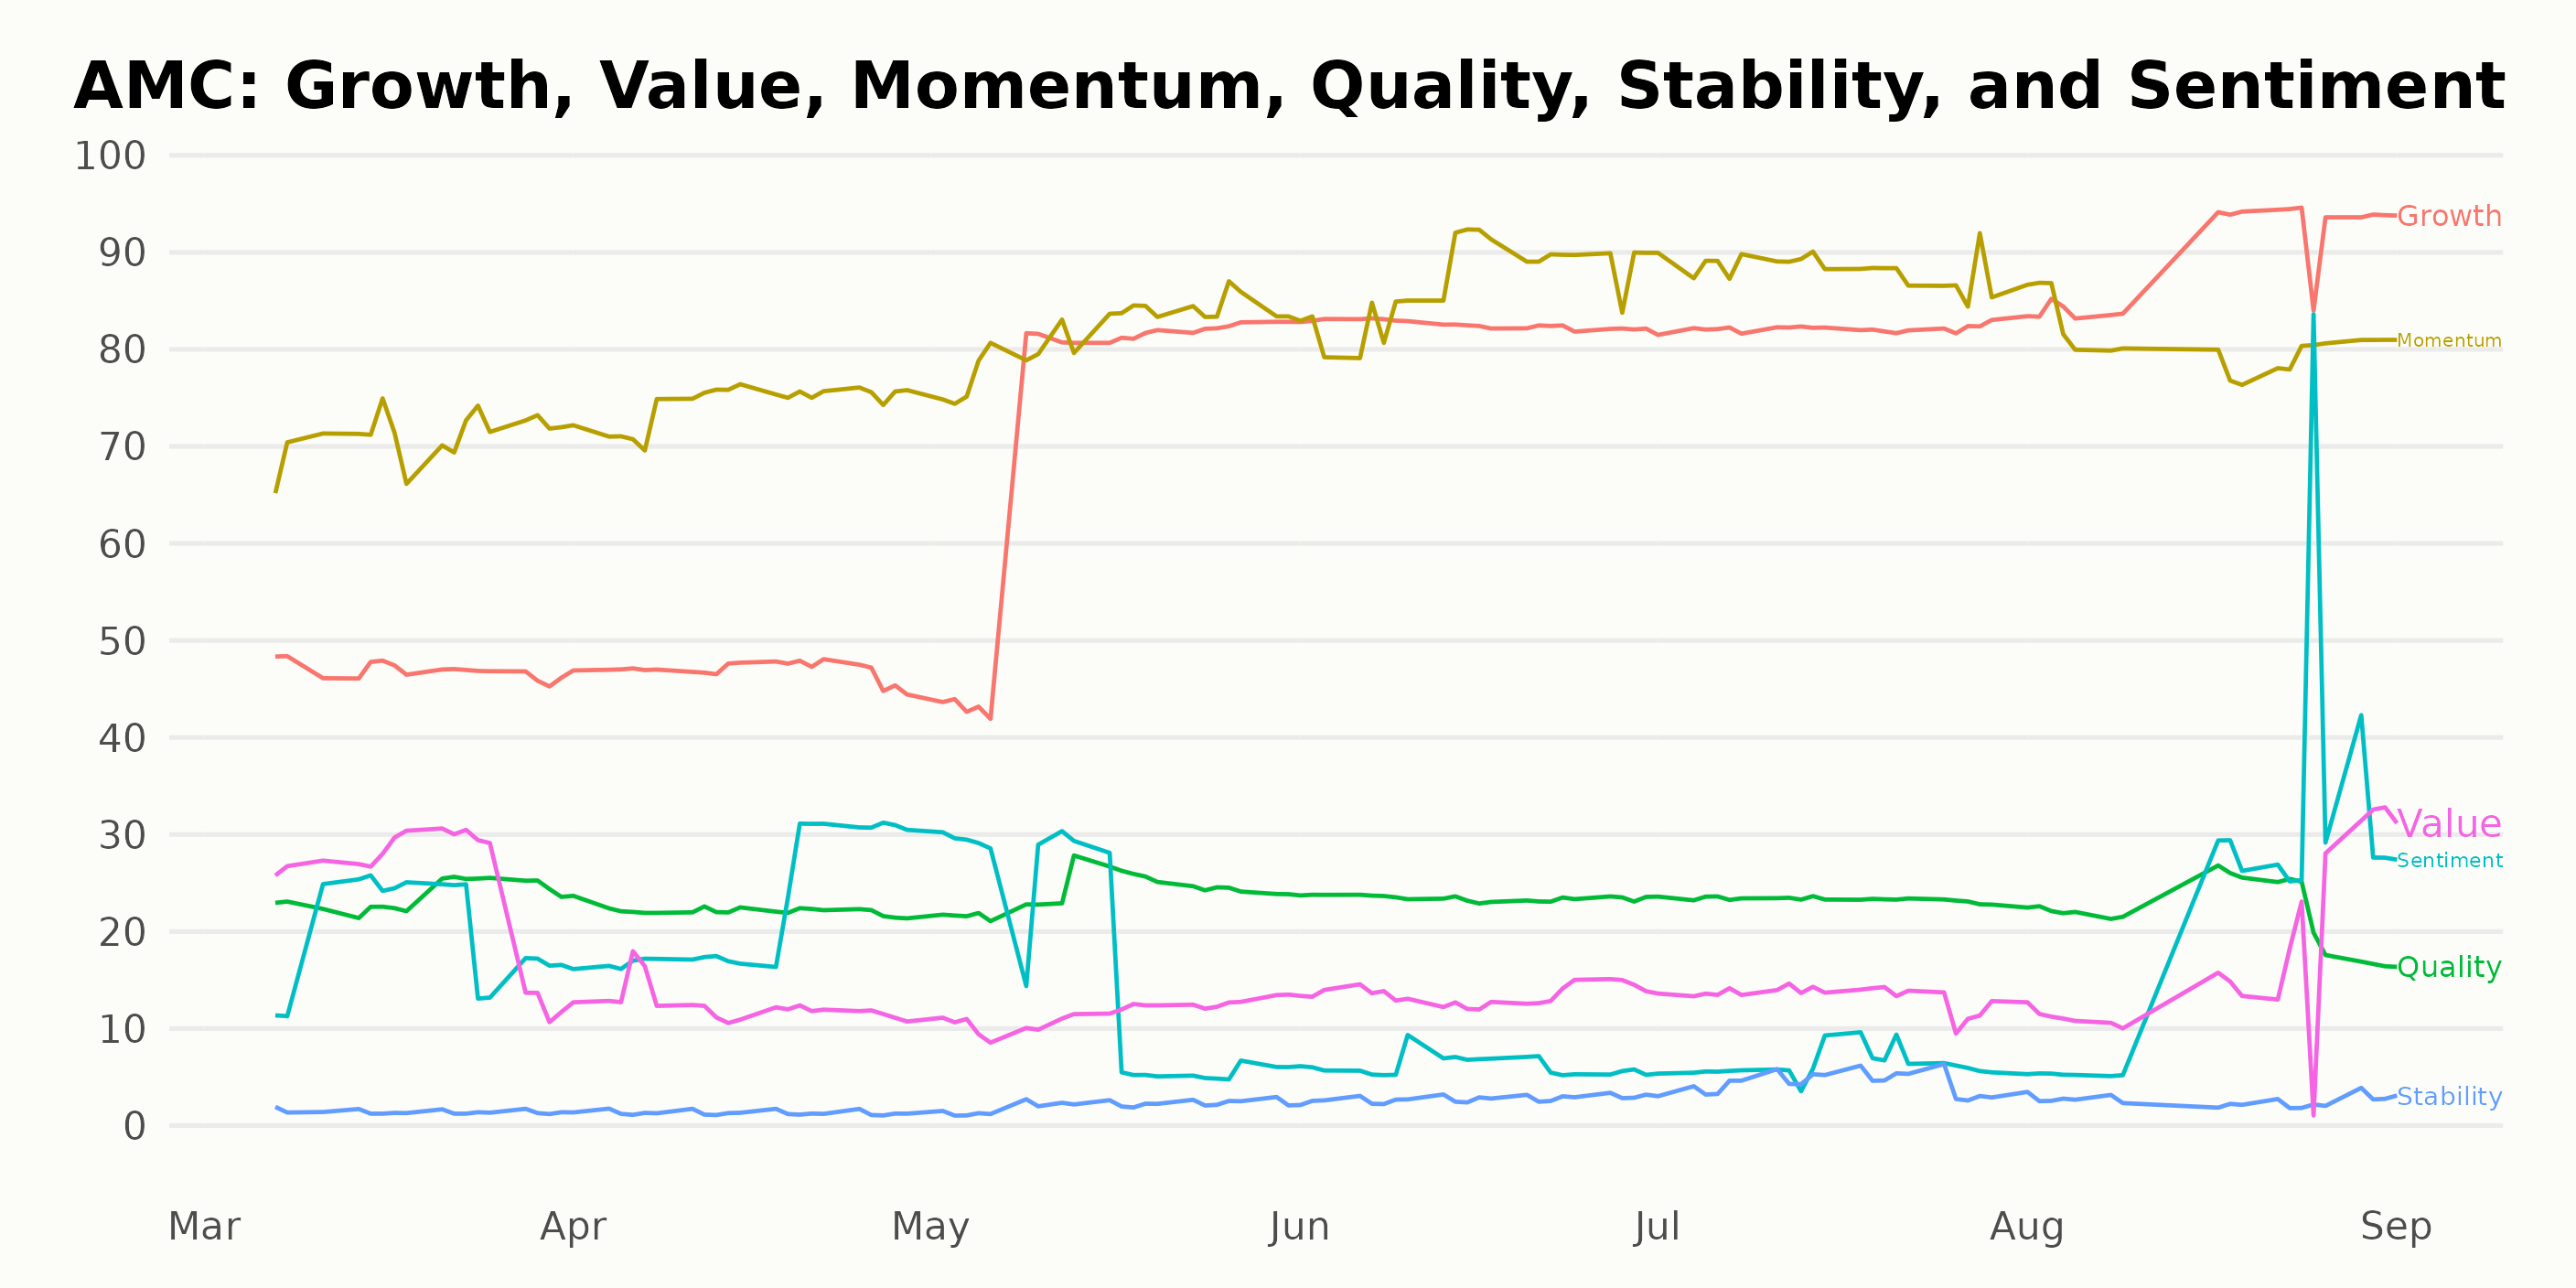
When we examine the POWR Ratings for AMC across multiple dimensions, it's clear that growth, momentum, and value are the most noteworthy aspects.
- Growth: Beginning in March 2023 with a rating of 47, AMC's growth rating takes a remarkable turn upwards. In May 2023, it surged to 73, continuing on an upward trajectory to peak at 90 in August 2023. This trend suggests a significant improvement in the company's growth perspective over this period.
- Momentum: The momentum rating for AMC also shows a rising trend. From a score of 71 in March 2023, it climbed steadily to reach 88 by July 2023, despite experiencing a slight dip to 81 in August 2023. This signifies the consistent strengthening of AMC's momentum during these months.
- Value: AMC's value rating demonstrates noticeable fluctuations. Initially, it was at 25 in March 2023, plummeted to 12 in April and May 2023, slightly inched up to 13 in June and July 2023 before reaching a slightly improved score of 17 in August 2023. Although there have been ups and downs, this trend indicates an overall drop followed by a mild recovery in the value rating.
These fluctuations in the ratings on the dimensions of growth, momentum, and value offer insights into the performance and potential of AMC.
Stocks to Consider instead of AMC Entertainment Holdings Inc. (AMC)
Other stocks in the sector that may be worth considering are Imax Corporation (IMAX), Lee Enterprises, Incorporated (LEE), and Urban One, Inc. (UONEK), which have better POWR Ratings.
What To Do Next?
Discover 10 widely held stocks that our proprietary model shows have tremendous downside potential. Please make sure none of these “death trap” stocks are lurking in your portfolio:
AMC shares were trading at $12.96 per share on Friday afternoon, up $0.41 (+3.27%). Year-to-date, AMC has declined -68.16%, versus a 18.70% rise in the benchmark S&P 500 index during the same period.
About the Author: Kritika Sarmah

Her interest in risky instruments and passion for writing made Kritika an analyst and financial journalist. She earned her bachelor's degree in commerce and is currently pursuing the CFA program. With her fundamental approach, she aims to help investors identify untapped investment opportunities.
The post What Should Investors Do with Shares of AMC Entertainment Holdings (AMC) This Week? appeared first on StockNews.com