


While NIO Inc. (NIO) struggled with production barriers due to pandemic-related shutdowns and supply chain disruptions, curbing expansion over the past year, the firm has made strides in escalating Electric Vehicle (EV) deliveries in recent months.
However, earlier this year, NIO said it is cutting prices for its cars and delaying plans to spend on business expansion and research as an effort to address the impact on cash flow from fewer car deliveries.
Moreover, analysts at China Merchants Bank International said, “It now also faces a dilemma between brand positioning and profitability, as it has started to cut service benefits, which could dent its brand image and thus sales more severely than expected.”
Although NIO shows potential for long-term growth, its immediate prospects are overshadowed by intensified competition and restrained market share.
Let’s examine some key metrics that underscore my bearish stance on the stock.
Analyzing NIO’s Financial Peaks and Troughs from 2020 to 2023
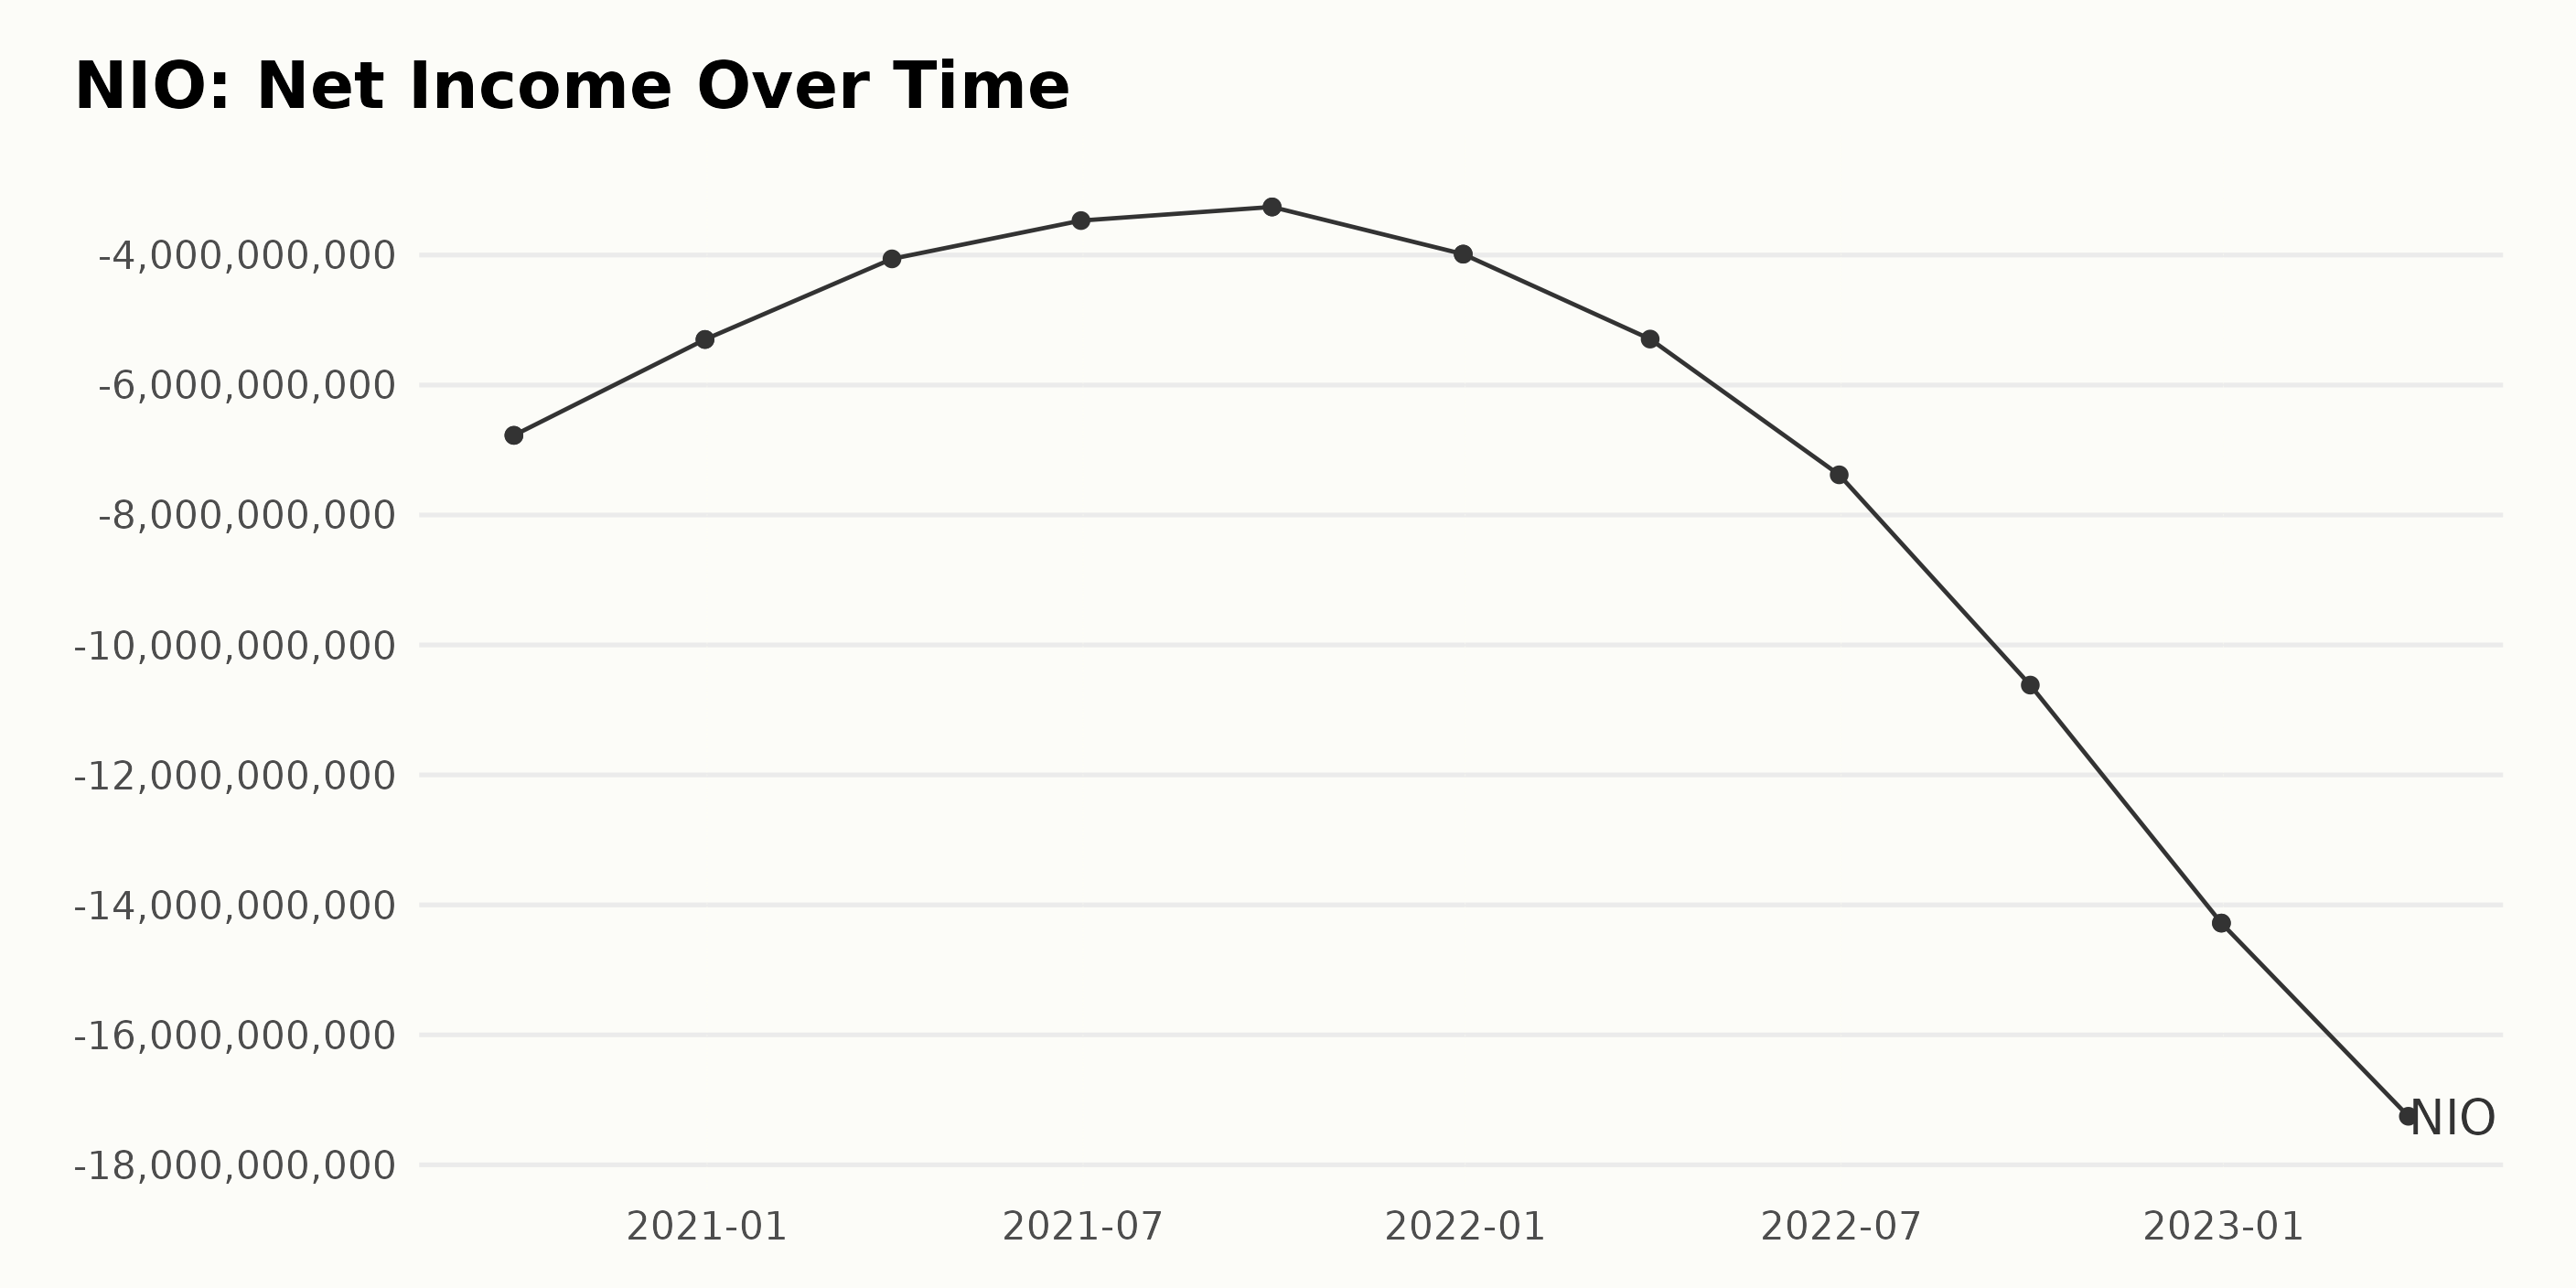
Based on the collected data, the trailing-12-month net income of NIO has illustrated an overall negative trend from September 30, 2020, to March 31, 2023. The net income initially came in at -$6.77 billion in September 2020 and then underwent slight fluctuations before gradually decreasing. For the series, there were moments where NIO’s net income increased, although it generally decreased over time with a noted emphasis on larger losses going into 2023. Here are some significant points:
- December 2020: Net income was -$5.30 billion
- September 2021: Net income improved slightly to -$3.26 billion
- June 2022: A substantial loss was reported at -$7.38 billion
- December 2022: Increased loss to -$14.28 billion
- March 2023: Net income reached -$17.25 billion
This trend indicates a steady increase in the losses that NIO is incurring. By comparing the first value in September 2020 to the last recorded in March 2023, it can be deduced that NIO’s net income dropped by approximately 154%, demonstrating a significant annual growth rate. While this drawback is noteworthy, it’s also essential to look into possible contributors to this scenario, such as potential increases in operating costs or decreases in revenues.
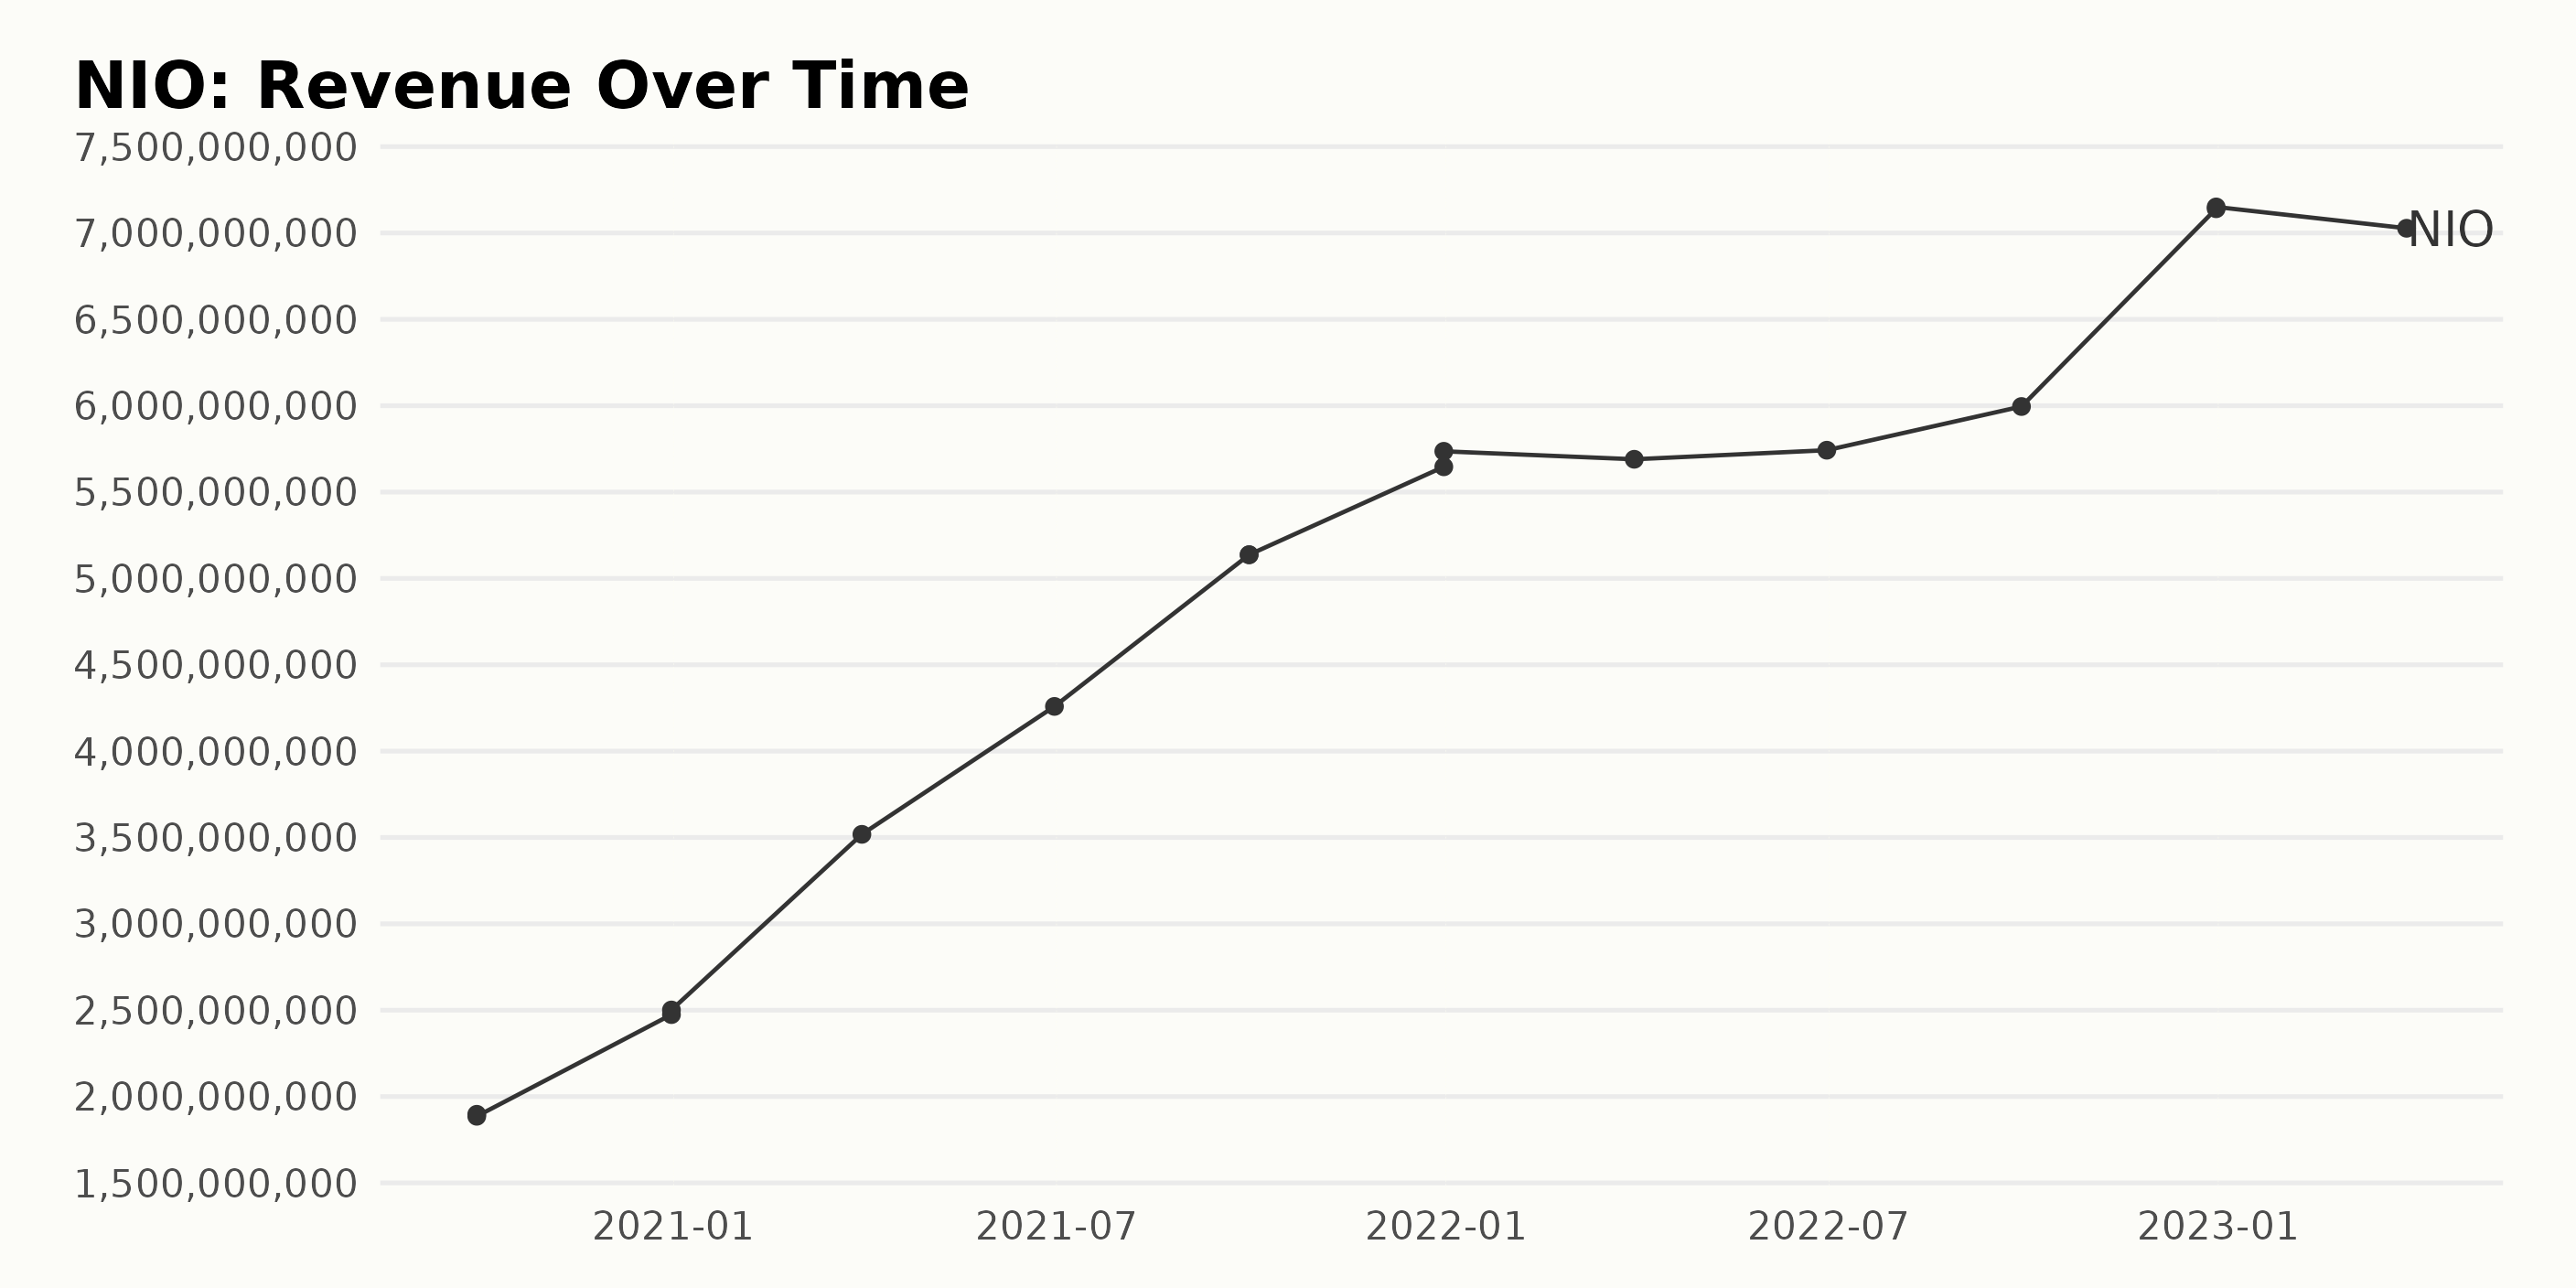
The trailing-12-month revenue pattern of NIO shows a significant upward trend in recent years following analysis of its quarterly records. Here’s a summary:
- As of September 30, 2020, the revenue was approximately $1.89 billion and $1.88 billion, showing slight fluctuation within the same quarter.
- The revenue saw considerable growth by December 31, 2020, reaching around $2.47 billion to $2.50 billion.
- In the first quarter of 2021, by March 31, the earnings spiked to about $3.52 billion, and by June 30, they further grew to roughly $4.26 billion.
- The trend continued with revenues increasing to around $5.13 billion as of September 30, 2021, and $5.64 billion to $5.73 billion by December 31, 2021.
- Despite some drops and stalls through 2022–with revenues at $5.69 billion (March 31), $5.74 billion (June 30), and $5.99 billion (September 30)—the last available data from December 31, 2022, shows impressive growth to approximately $7.14 billion and $7.15 billion.
- However, there was a slight decline in the first quarter of 2023, with the revenue recorded as $7.03 billion on March 31.
Therefore, from the initial values of the period under review to the latest data, NIO’s revenue has witnessed a substantial growth rate.
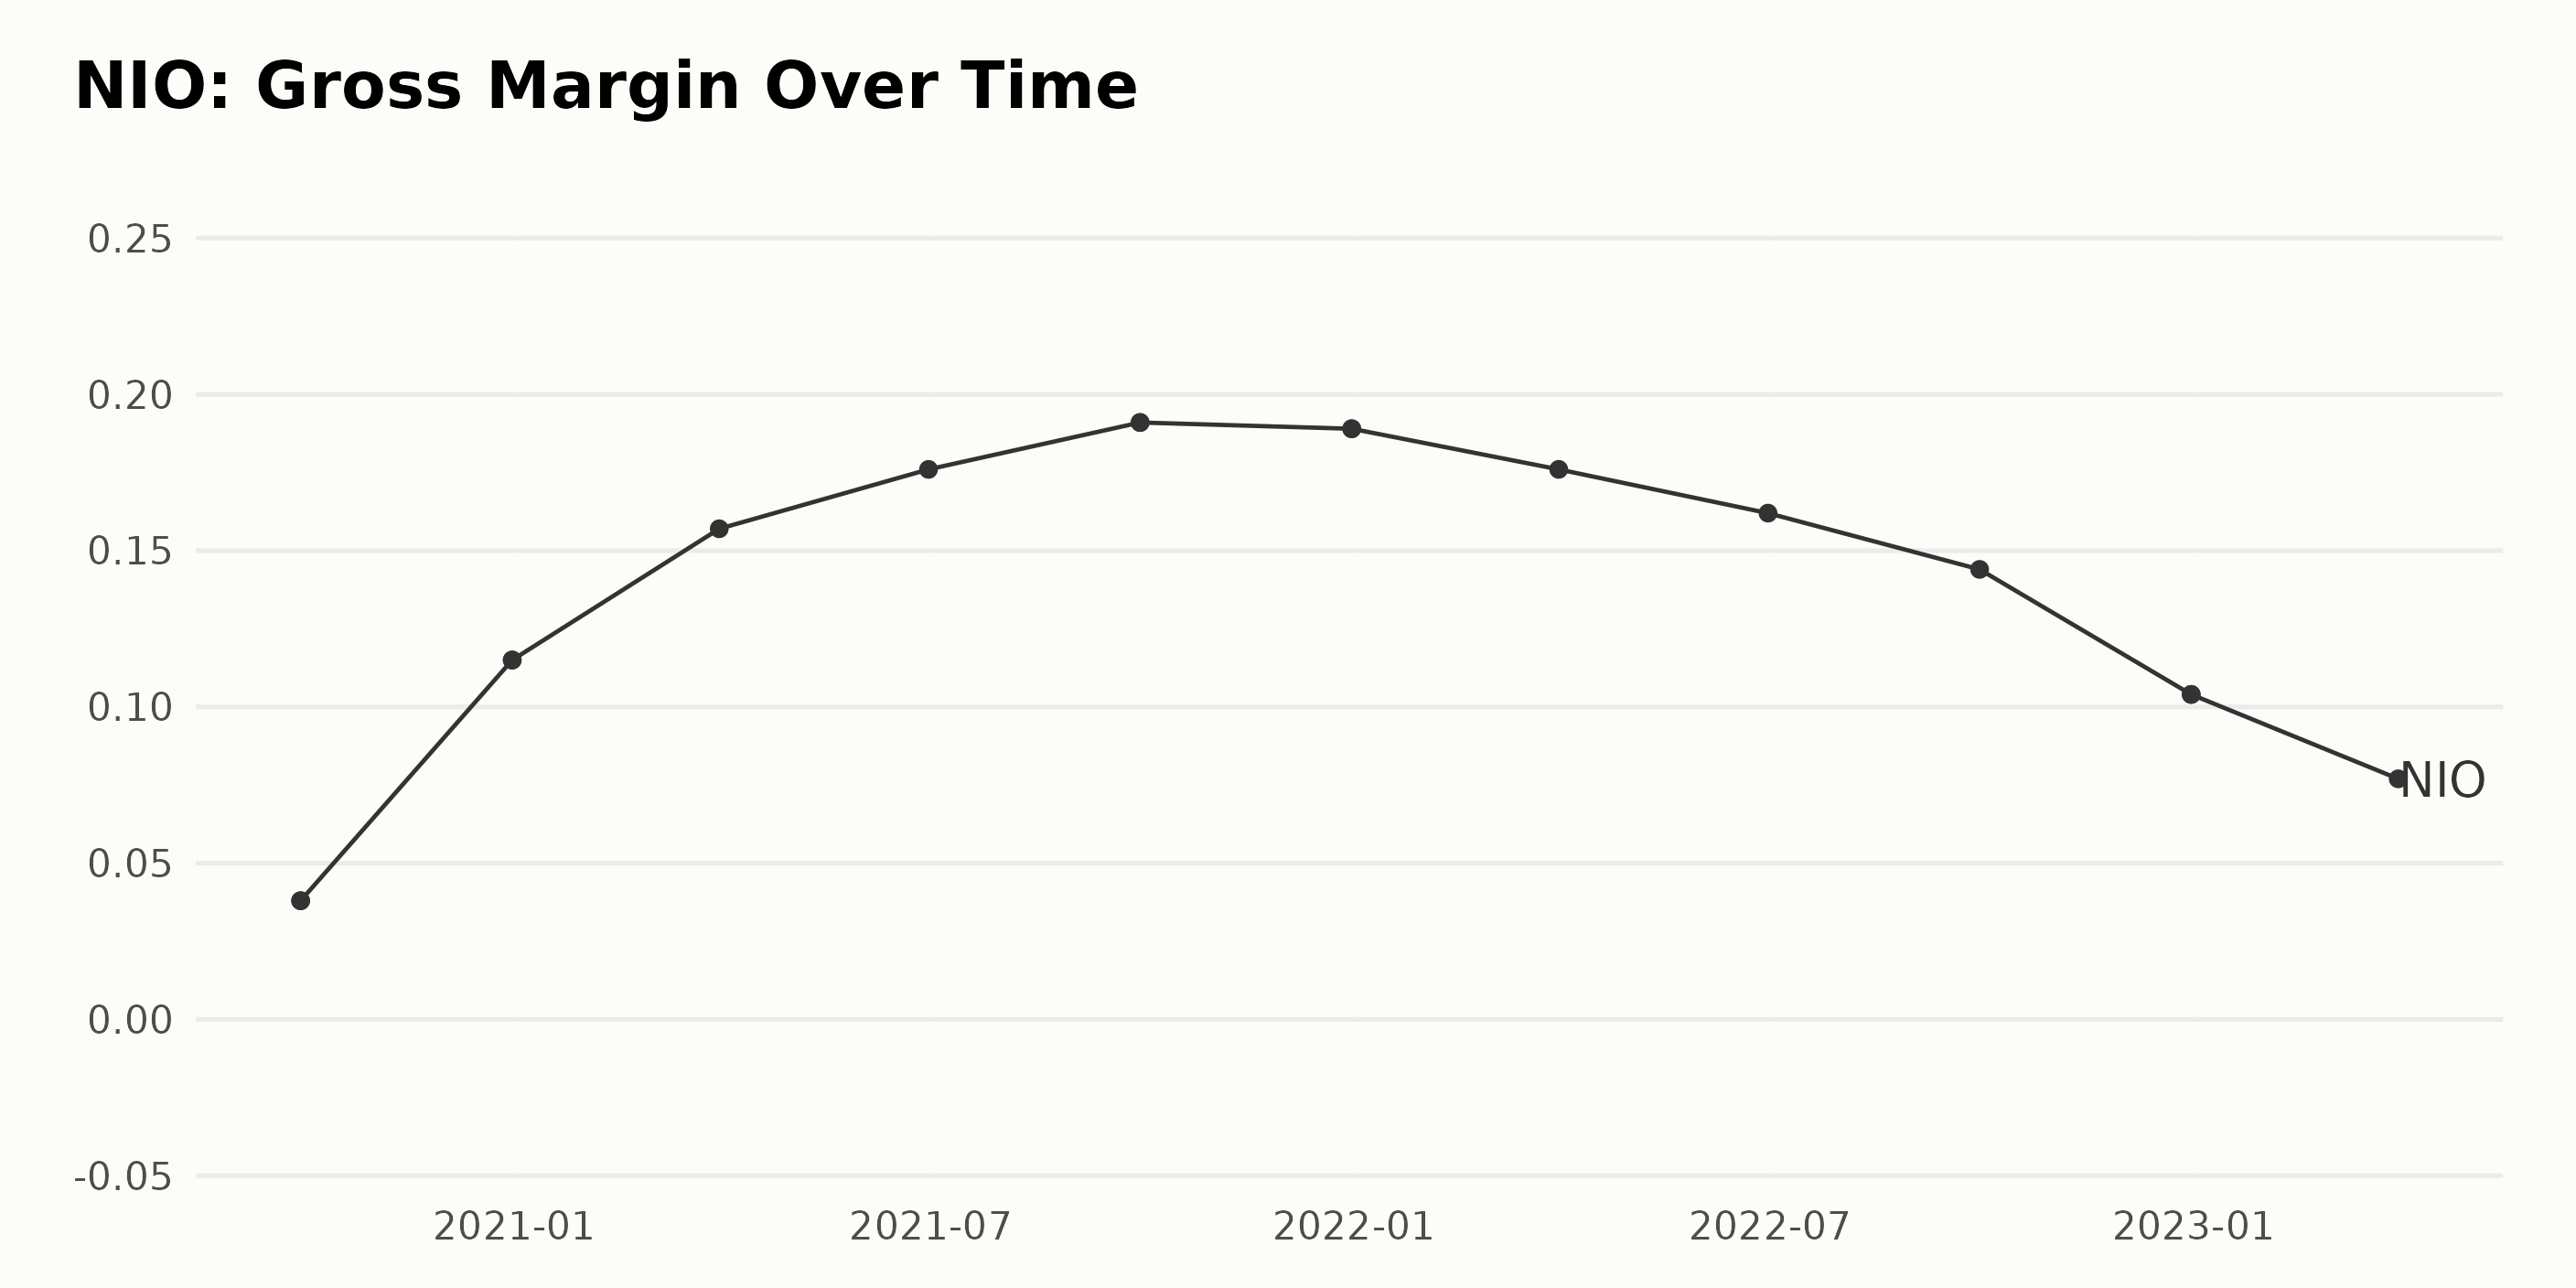
The gross margin of NIO has demonstrated fluctuating trends over the past few years. Below is an overview of the changes:
- As of September 30, 2020, the company’s gross margin was at 3.8%.
- There was a significant rise by the end of the year, with the figure more than tripling to 11.5% by December 31, 2020.
- The growth trend continued into 2021, with the gross margin reaching 15.7% by March 31, 17.6% by June 30, reaching its peak of 19.1% by September 30.
- The margin dropped slightly by December 31, 2021, registering 18.9%.
- This downward trend continued well into 2022, with figures slipping to 17.6% by March 31, 16.2% by June 30, and then reduced further to 14.4% by September 30.
- By the end of 2022, the gross margin significantly dropped to 10.4% on December 31.
- The first quarter of 2023 saw a further reduction, with the gross margin weighing in at 7.7% as of March 31.
Keeping the emphasis on more recent data, it can be observed that while NIO experienced steady growth in gross margin from late 2020 to late 2021, it has since been on a relatively sharp decline. The latest value of 7.7% signifies a slump compared to the 19.1% peak seen in September 2021. This represents a decline rate of approximately 60%. A comparison of the start and end points (from September 30, 2020, to March 31, 2023) shows an overall increase, transforming the initial figure of 3.8% to the current 7.7%. However, the recurring decline trend suggests caution going forward.
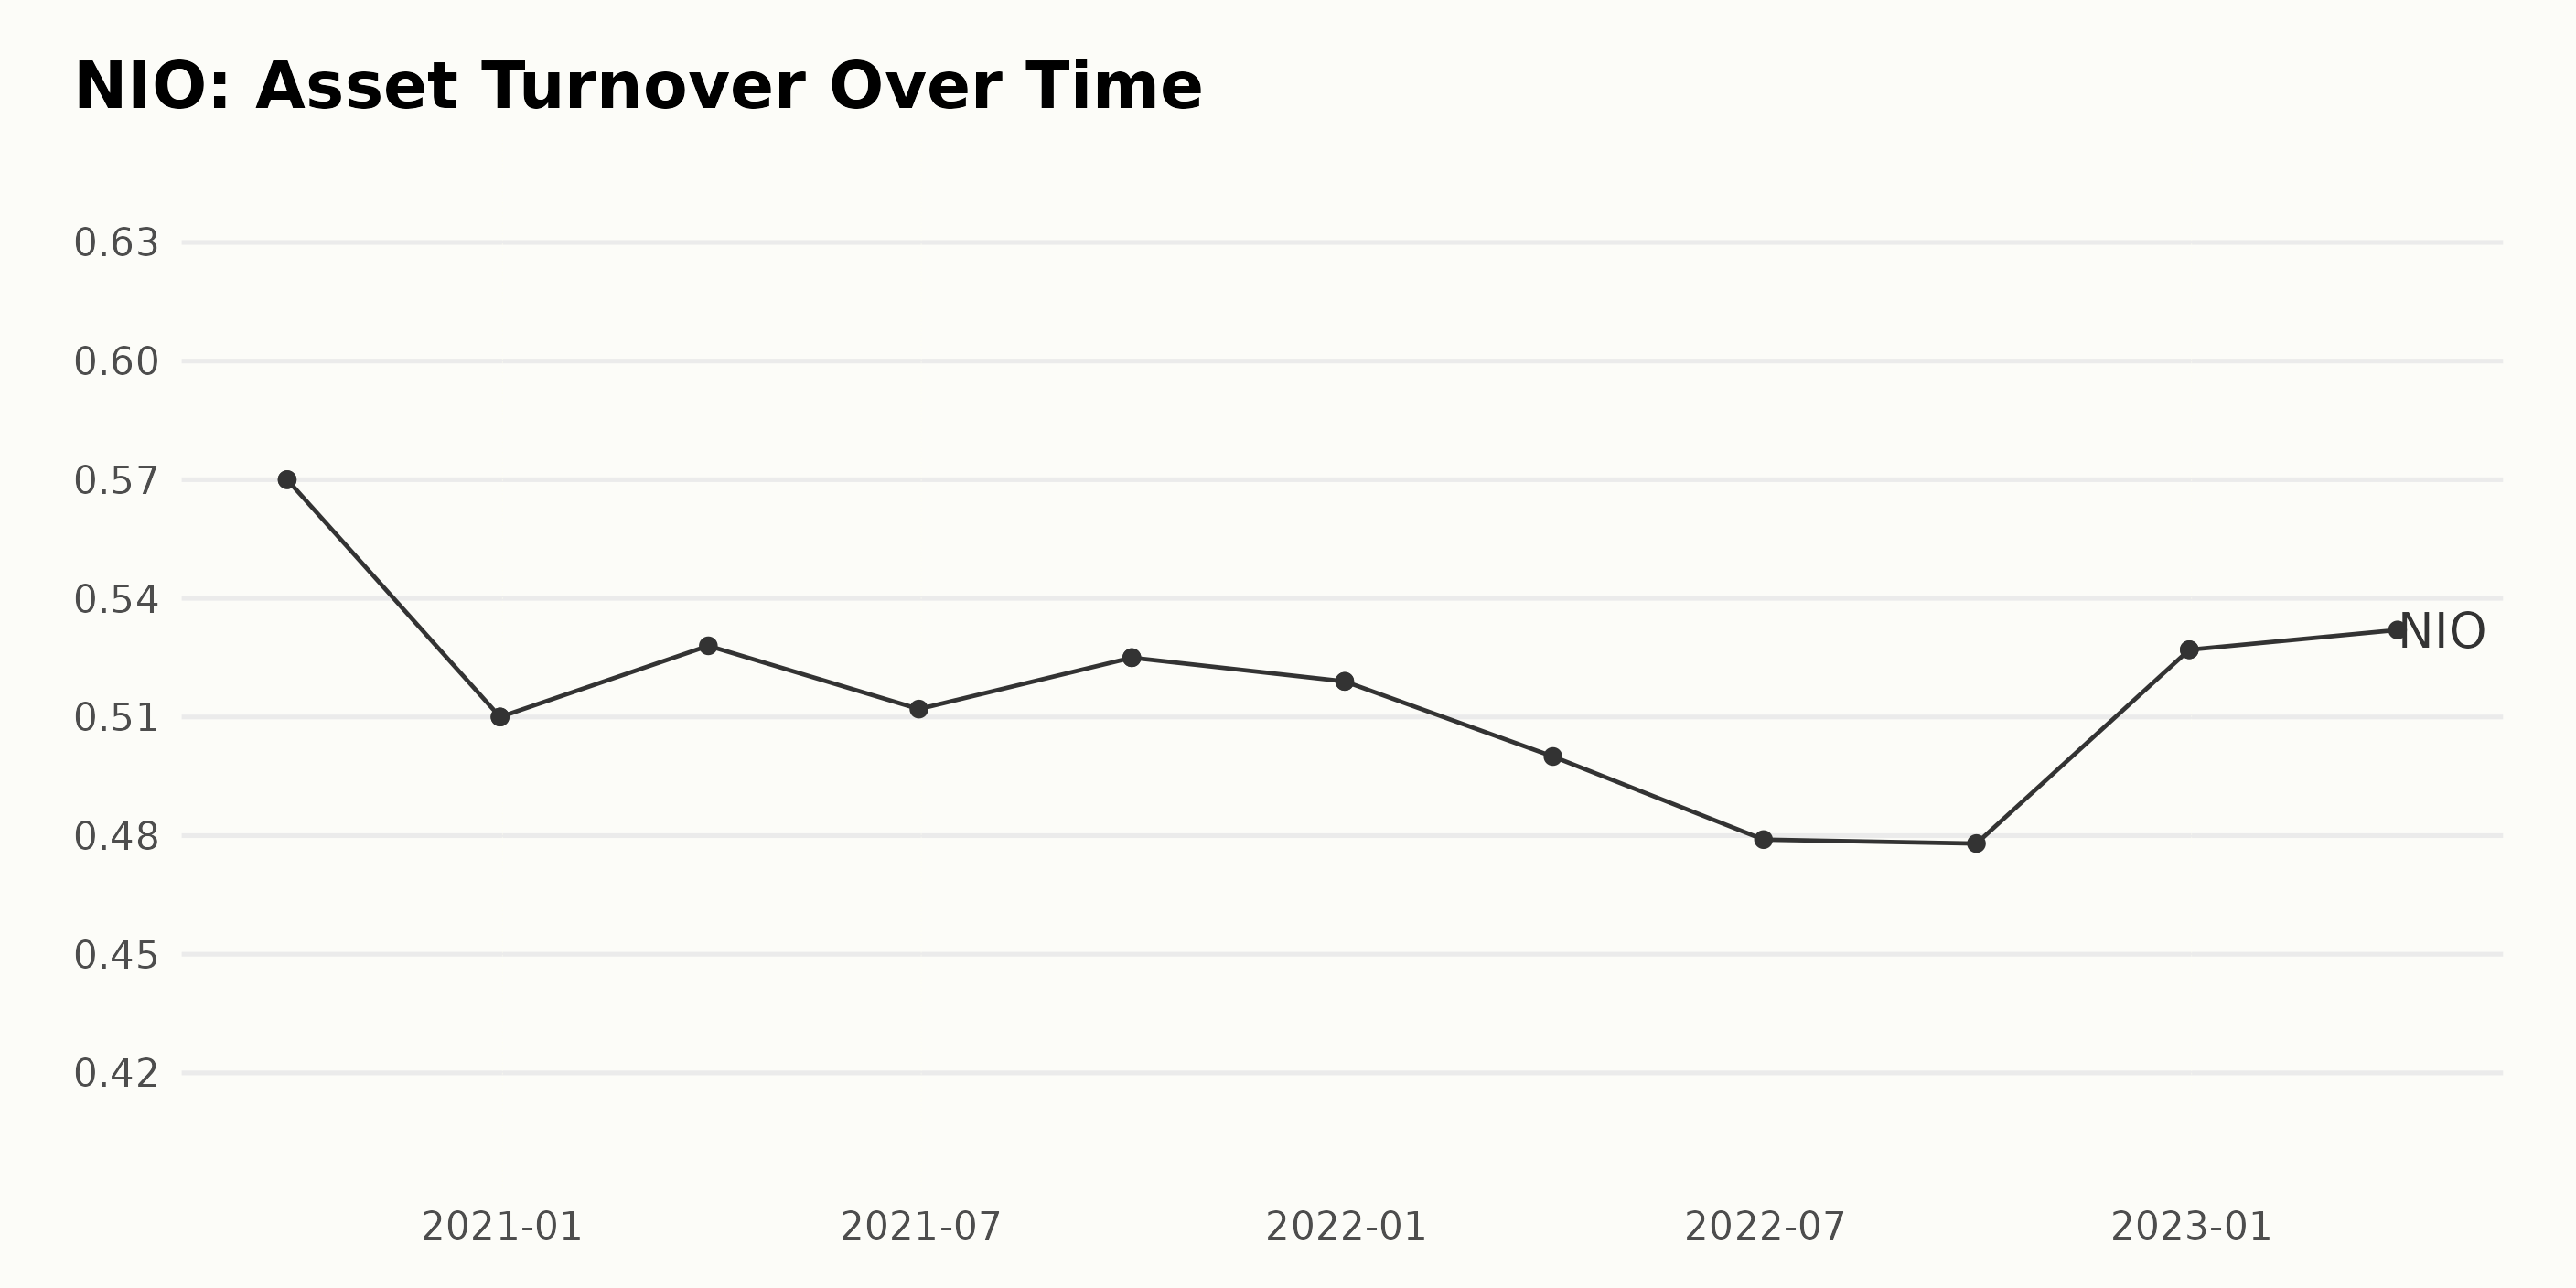
The Asset Turnover data for the NIO demonstrates a slight downward trend over the past three years, with some intermittent peaks and troughs. Here are some notable points in this dataset:
- September 2020: The Asset Turnover value began at 0.57.
- December 2020: There was a decrease to 0.51 by the end of 2020.
- March 2021: A slight rebound occurred to 0.528 in March 2021.
- June 2021: A small drop followed in June 2021 to 0.512.
- September 2021: The value increased slightly to 0.525.
- December 2021: By the end of 2021, there was a minor fall to 0.519.
- June 2022: The lowest value so far took place in June 2022 at 0.479.
- December 2022: By December 2022, it peaked again at 0.527.
- March 2023: The latest value in the series, from March 2023, is 0.532.
Over the observed period, there’s a fairly constant fluctuation within the range of 0.5, but overall, the growth rate, measured from September 2020 to March 2023, indicates a decrease of about 6.67%.
Fluctuations and Accelerated Growth: NIO’s 2023 Stock Performance
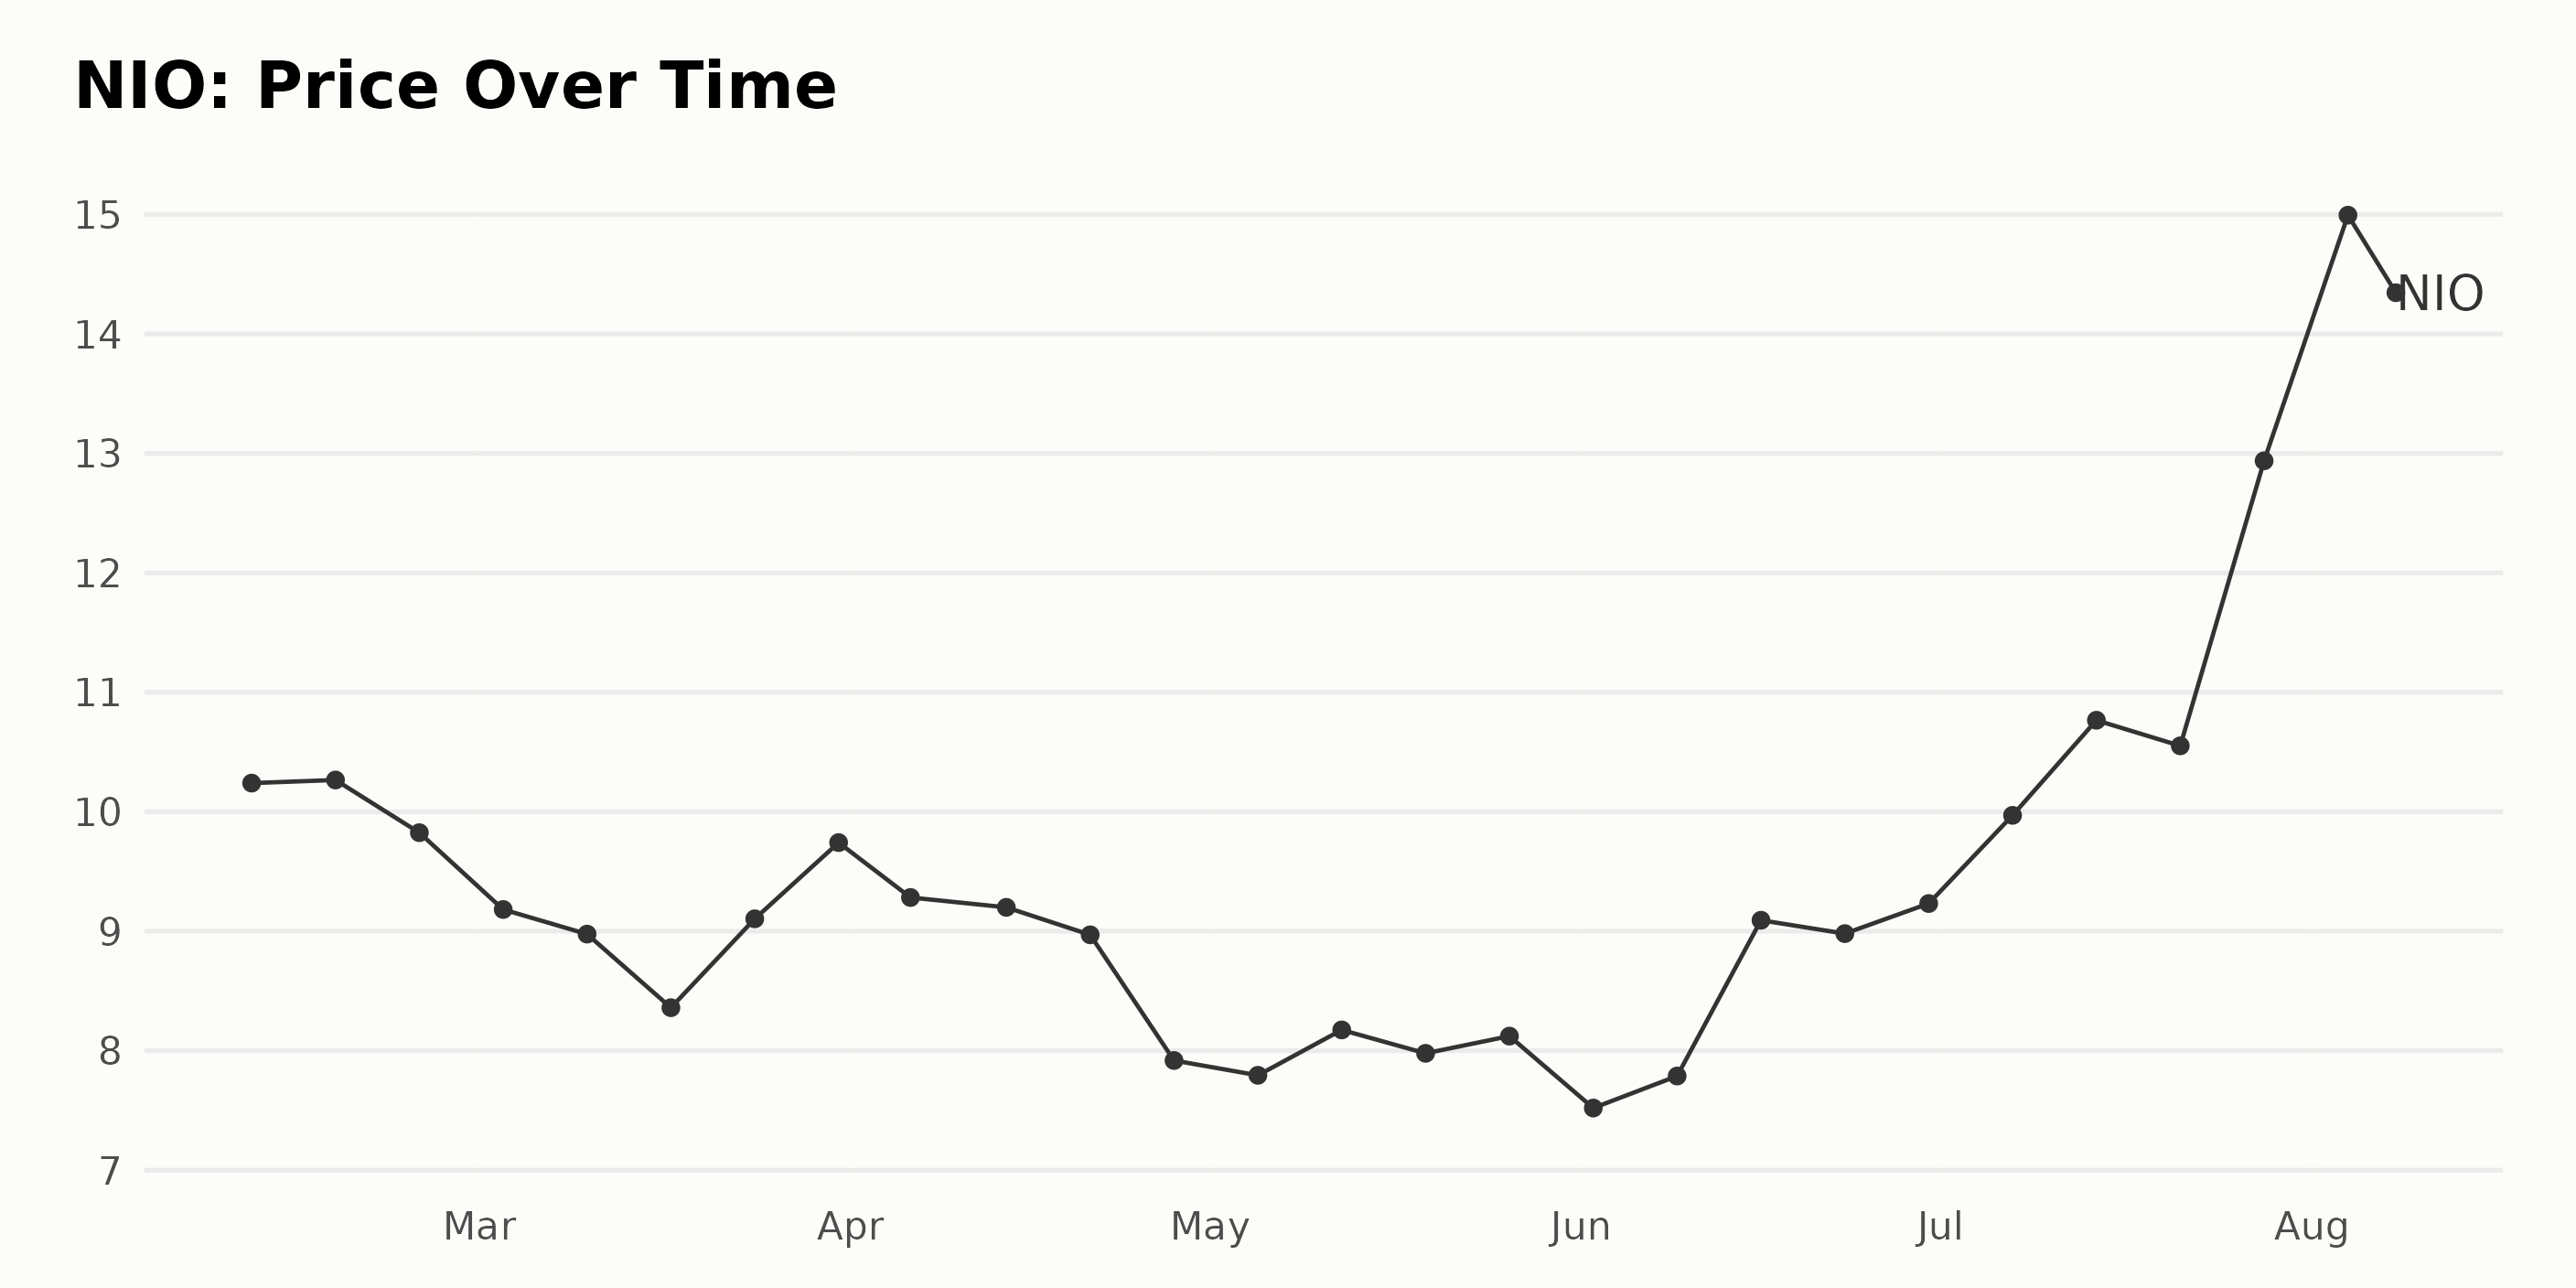
The share price of NIO shows a fluctuating trend from February 2023 to August 2023, with a noticeable growth acceleration in the last two months.
- In February 2023, the share price slightly increased from $10.24 on February 10, 2023, to $10.27 on February 17, 2023, but subsequently fell to $9.83 by the end of the month.
- Throughout March 2023, a declining trend was initially observed as the share price went down from $9.18 on March 3, 2023, to $8.36 on March 17, 2023. However, it gradually recovered to $9.74 by the end of the month.
- In April 2023, the share price continued to oscillate, starting at $9.28 on April 6, 2023, reaching $9.2 on April 14, 2023, then falling to $7.92 by the end of April 2023.
- The downtrend briefly reversed in early May 2023, with the price climbing to $8.17 on May 12, 2023, before falling back to $7.98 on May 19, 2023, and slightly increasing to $8.12 by the end of May 2023.
- For June 2023, the share price started at $7.52 and exhibited a rollercoaster pattern, including an increase to $9.09 by June 16, a slight drop to $8.98 by June 23, and finally rising to $9.23 by the end of the month.
- Starting in July 2023, a robust accelerating growth trend was observed. The price continuously climbed throughout the month, starting from $9.97 on July 7, 2023, and reaching a high of $12.94 on July 28, 2023.
- The accelerated growth continued into August 2023, where it reached its peak of $14.99 on August 4, 2023, before concluding at $14.07 on August 8, 2023.
While NIO’s share price showed some volatility from February to June 2023, a definite accelerating growth trend was evident starting in July 2023 and continuing into August 2023.
Here is a chart of NIO’s price over the past 180 days.
Analyzing NIO’s POWR Ratings
NIO has an overall F rating, translating to a Strong Sell in our POWR Ratings system. It is ranked #52 out of the 56 stocks in the Auto & Vehicle Manufacturers category.
Here is a closer examination of its rankings within the category:
- As of February 11, 2023, NIO is ranked 51.
- March showed some deterioration, with NIO descending to the ranks 53 and 55 in the weeks of March 4 and March 11, respectively. However, it recovered back to rank 51 by March 25.
- In April 2023, although NIO improved its position slightly to rank 49 on April 15, it again shifted to rank 50 by April 22.
- In May, fluctuation continued, with the ranking reaching as low as 52 by May 20.
- A consistent performance was observed in June, where NIO’s rank mostly remained at 52 and 53, briefly peaking at 54 on June 10.
- July saw an encouraging improvement, with NIO ascending to rank 46 by July 22, leading us to believe that the company’s standing within the category may have improved compared to previous months.
- However, August shows signs of reversal, especially considering its latest recorded position on August 8, 2023, sitting at rank 52.
Considering these findings, it can be interpreted that NIO’s POWR grade and category rank denotes a suboptimal performance among Auto & Vehicle Manufacturers. While there have been periods of slight improvement, the overarching trend remains largely unfavorable.
Stocks to Consider Instead of NIO Inc. (NIO)
Other stocks in the Auto & Vehicle Manufacturers sector that may be worth considering are Mercedes-Benz Group AG (MBGAF), Honda Motor Co. Ltd. (HMC), and Subaru Corp. (FUJHY) -- they have better POWR Ratings.
What To Do Next?
Get your hands on this special report with 3 low priced companies with tremendous upside potential even in today’s volatile markets:
3 Stocks to DOUBLE This Year >
NIO shares were trading at $14.02 per share on Wednesday morning, down $0.05 (-0.36%). Year-to-date, NIO has gained 43.79%, versus a 18.19% rise in the benchmark S&P 500 index during the same period.
About the Author: Subhasree Kar

Subhasree’s keen interest in financial instruments led her to pursue a career as an investment analyst. After earning a Master’s degree in Economics, she gained knowledge of equity research and portfolio management at Finlatics.
The post Should You Consider Buying or Selling NIO (NIO) Right Now? appeared first on StockNews.com