


Forgive my inner child for laughing so hard at this. But one of the greatest investment terms was coined this week in that the market got “Fitch Slapped”.
Meaning that the Fitch ratings downgrade for US debt slapped the investment world into submission this week. Not just a long overdue softening of stock prices as the S&P 500 (SPY) retreated from recent highs. There was also a reversal of course of long term bond rates as they headed higher once again.
Beyond that we also got served up the Big 3 economic reports this week. So there is much investment news to digest to plot our course in the days and weeks ahead.
Market Commentary
Plain and simple, the Fitch downgrade of US debt was the “Easy Button” excuse for a long overdue sell off. I don’t believe anyone is terribly worried about a debt crisis occurring any time soon.
That’s because there are several other large developed countries with as high if not higher levels of government debt vs. GDP. One of them will most certainly topple before the US like Japan, Italy, Spain, UK etc.
Yes...when those problems start to bubble up, THEN it’s time to get worried about US debt problems coming next which would be bad news for both the stock and bond market. In the meantime we are still in the midst of a new bull market where some recent gains needed to be taken off the table.
With the Fed looking ready to end the rate hike cycle, investors just want to make sure that the soft landing doesn’t devolve into a recession. To help us gauge that investors will look closely at the Big 3 economic reports this week.
First up was ISM Manufacturing on Tuesday. The 46.4 is no doubt a weak showing. But investors care more about the direction of things and what that means for the future.
As such, that reading was a step up from 46.0 in the previous month. Plus New Orders jumped from 45.6 to 47.3 which points to things getting better in the future.
On Thursday we got the ISM Services reading at 52.7 when 52.0 was expected. On top of that the New Orders was a healthy 55.0 which points to even better readings down the road.
However, if I were to point to a negative in these reports, both showed a noticeable drop in the Employment readings: 44.4 and 50.7 respectively. Combine that with the JOLTs report this week showing another reduction in job openings and it could be a sign that the jobs market is about to weaken.
Remember the changed language from the Fed at the late July meeting. They no longer expect a recession to emerge before their fight against high inflation is over. However, they do still predict a softening in economic growth and a slight increase in the unemployment rate.
That employment piece is a hard plane to land because often when the unemployment rate starts to rise...it keeps getting much worse than expected. That will means investors will probably be most focused on the employment part of the economic picture to best determine how bullish or bearish they want to be.
So that brings us around to the final, and most important part of the Big 3 economic reports. That being the Government Employment Situation report on Friday morning.
This was pretty much a Goldilocks type result. Not too hot...not too cold...just right.
The inline showing explains why stocks are bouncing Friday morning after a spate of recent weakness. However, it is was not all rainbows and lollipops.
The blemish is that the Fed has been very focused on wage inflation which has been too sticky. Indeed it stuck at +4.4% year over year when investors expected it slow down to 4.2%.
Even the month over month reading was higher than expected at +0.4% which points to nearly 5% annualized pace. This single point could have the Fed being a bit more stubborn with their hawkish rate plans.
Trading Plan
At this moment there is no reason to doubt that the bull market is still in place. However, stocks have been going up virtually non stop since March. That puts us in overbought territory...which makes now the perfect time place in which to see a 3-5% pullback before advancing higher.
This is healthy and normal. What pros often call “the pause that refreshes”.
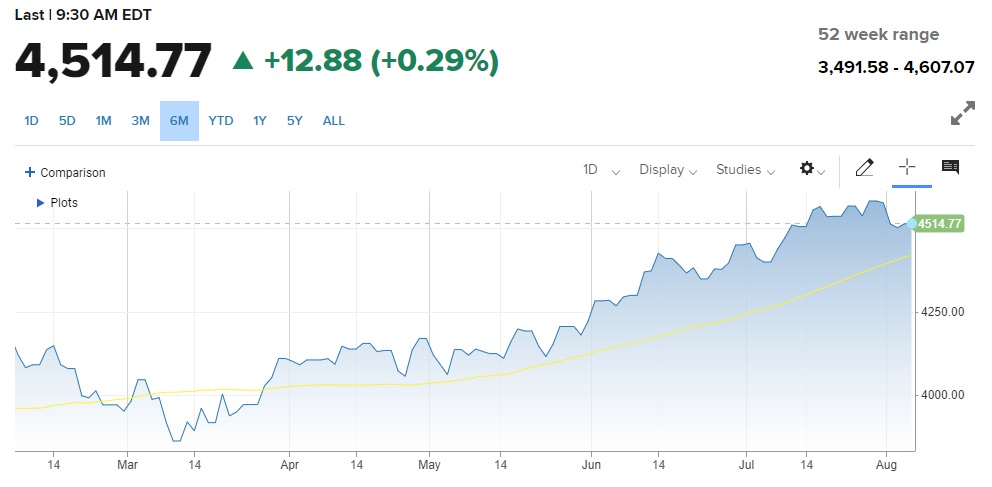
I think the 50 day moving average (yellow line below) at 4,400 is a likely short term destination for stocks on the downside. This would help frame a comfortable 200 point trading range with 4,600 on the high side.
Note that I don’t think the S&P 500 ends the year much higher than the 4,600 level we just touched. Rather, most of the large caps leading that index have already had their fun. Instead I see the gains broadening out with small and mid caps taking charge.
Remember that the Russell 2000 small cap index is still about 15% under its all time highs. Compare that to the idea that small caps outperform large caps over the long haul. Meaning its time for some reversion to the mean and these deserving stocks getting more investor attention.
What To Do Next?
Discover my current portfolio of 3 hand picked stocks packed to the brim with the outperforming benefits found in our POWR Ratings model.
Plus I have added 4 ETFs that are all in sectors well positioned to outpace the market in the weeks and months ahead.
This is all based on my 43 years of investing experience seeing bull markets...bear markets...and everything between.
If you are curious to learn more, and want to see these 7 top picks for today’s market, then please click the link below to get started now.
Steve Reitmeister’s Trading Plan & Top Picks >
Wishing you a world of investment success!

Steve Reitmeister…but everyone calls me Reity (pronounced “Righty”)
CEO, StockNews.com and Editor, Reitmeister Total Return
SPY shares were trading at $451.30 per share on Friday morning, up $2.46 (+0.55%). Year-to-date, SPY has gained 18.90%, versus a % rise in the benchmark S&P 500 index during the same period.
About the Author: Steve Reitmeister

Steve is better known to the StockNews audience as “Reity”. Not only is he the CEO of the firm, but he also shares his 40 years of investment experience in the Reitmeister Total Return portfolio. Learn more about Reity’s background, along with links to his most recent articles and stock picks.
The post Stock Market Gets “Fitch Slapped” appeared first on StockNews.com