


UiPath, Inc. (PATH) provides an end-to-end automation platform that offers a range of robotic process automation solutions, primarily in the United States, Romania, and Japan. The company offers a suite of interrelated software to build, manage, run, engage, measure, and govern automation within the organization.
Last month, PATH announced its latest AI-powered automation features that accelerate customers’ ability to discover, automate, and operate automation at scale through Generative AI and Specialized AI.
According to McKinsey’s report on the economic impact of Generative AI, automation potential has experienced a significant surge. The integration of these advanced technologies has increased from approximately 50% to a remarkable 60-70% rise in hours that could theoretically be automated.
PATH's Business Automation Platform is enhancing its AI offerings with the rollout of Generative AI, which includes the general availability of established AI solutions OpenAI and Azure OpenAI connectors, both equipped with support for the powerful GPT-4.
PATH’s existing customers are leveraging the OpenAI connector to intensify automation within business operations and transform raw data into actionable insights. Such innovations continuously redefine the business automation landscape, offering businesses various opportunities for efficiency and growth.
For years PATH has invested in Machine Learning (ML) models and domain-specific AI for understanding interfaces, mining tasks, and processing documents and communications.
This foundation, with the recent advancements in generative AI, is anticipated to strengthen the company’s platform, unlocking a new wave of opportunities to democratize automation, increasing the number of use cases, and driving faster time to value and overall ROI.
For the full year fiscal 2024, PATH expects its revenue in the range of $1.267 billion to $1.272 billion, ARR in the range of $1.427 billion to $1.432 billion as of January 31, 2024, and non-GAAP operating income of approximately $168 million.
However, its stretched valuation is concerning. In terms of forward EV/Sales, it is trading at 6.84x, 123.8% higher than the industry average of 3.06x, while its forward Price/Sales multiple of 8.21 is 174% higher than the industry average of 2.99. Also, its forward non-GAAP P/E multiple of 54.81 is 124% higher than the industry average of 24.47.
Let’s look at the trends of some of PATH’s key financial metrics to understand why it could be wise to wait for a better entry point in the stock.
Analyzing PATH's Financial Performance Through its Key Metrics (2021-2023)
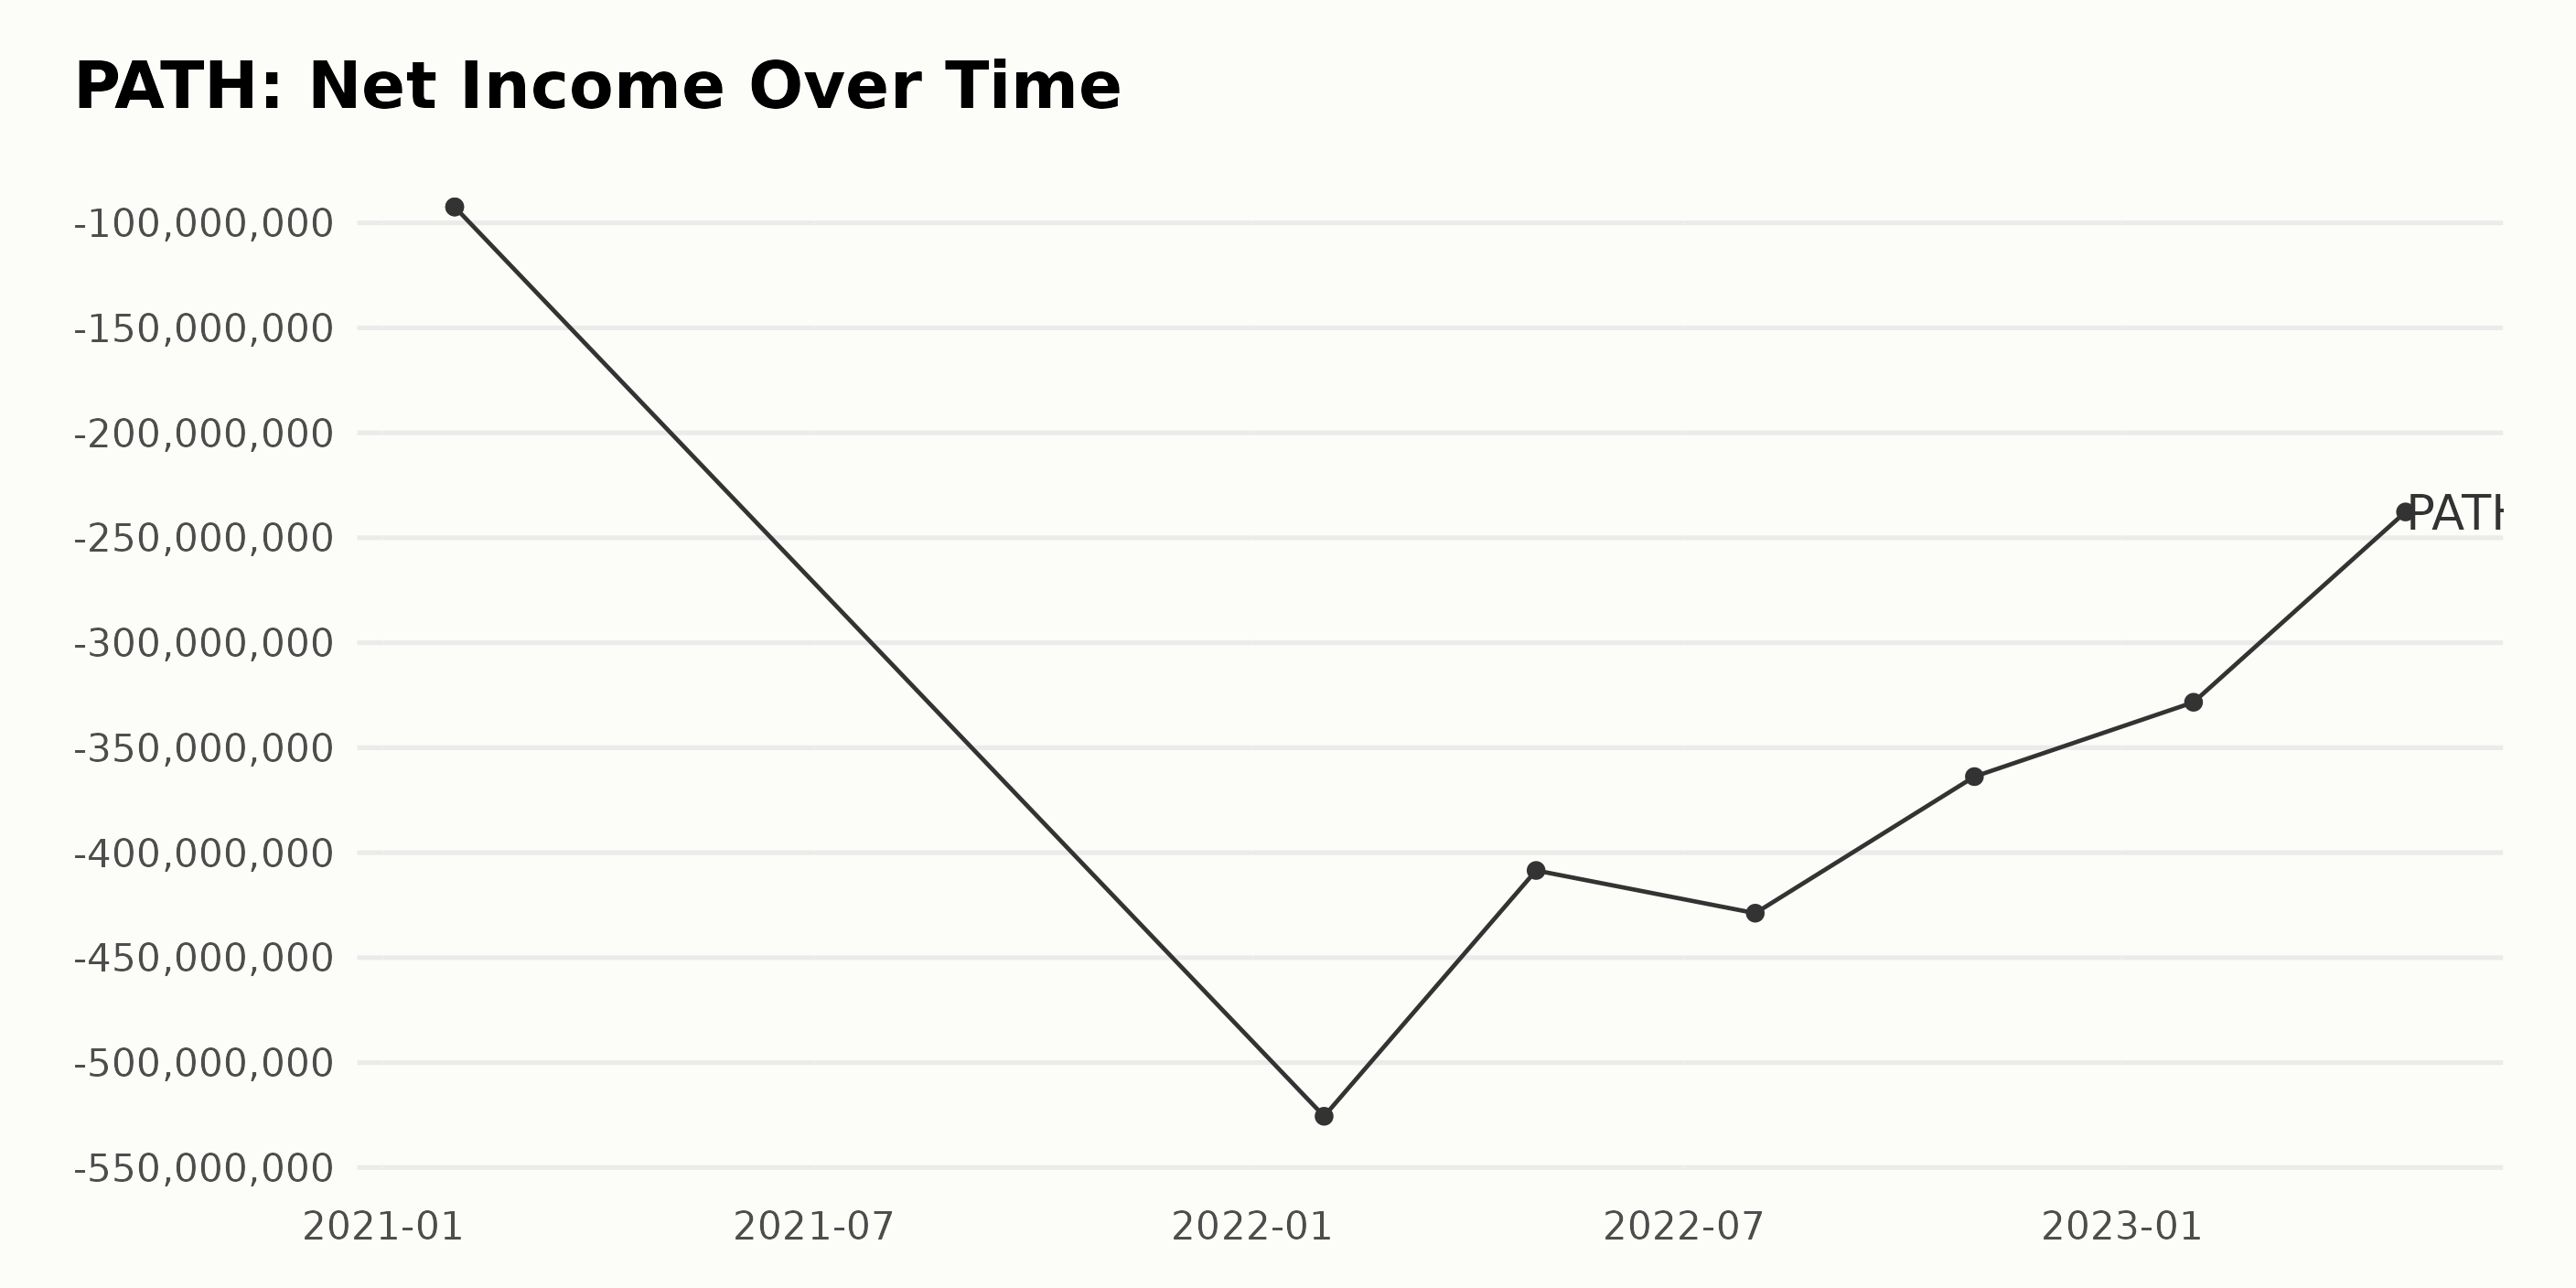
PATH’s trailing-12-month net income fluctuated negatively from January 2021 through April 2023.
- January 2021: -$92.39 million. This represented a significant financial loss for the company at that time.
- January 2022: -$525.59 million. This indicates a substantially deeper loss.
- April 2022: -$408.48 million
- October 2022: -$363.77 million
Hypothetically continuing the trend into 2023, the losses seemed to have lessened, revealing a slight improvement.
- January 2023: -$328.35 million
- April 2023: -$237.69 million
It is crucial to recognize such substantial negative income fluctuations, as they reflect financial instability in the company. Despite some improvements seen in the last reported value in April 2023 compared to the beginning of the series, the persistent net loss results emphasize PATH’s deep-rooted financial difficulties.
The calculated growth rate, taken by measuring the last value from the first, shows that the losses increased by approximately 157%, indicating further financial deterioration over the observed period. Hence, stakeholders should monitor such financial health indicators closely.
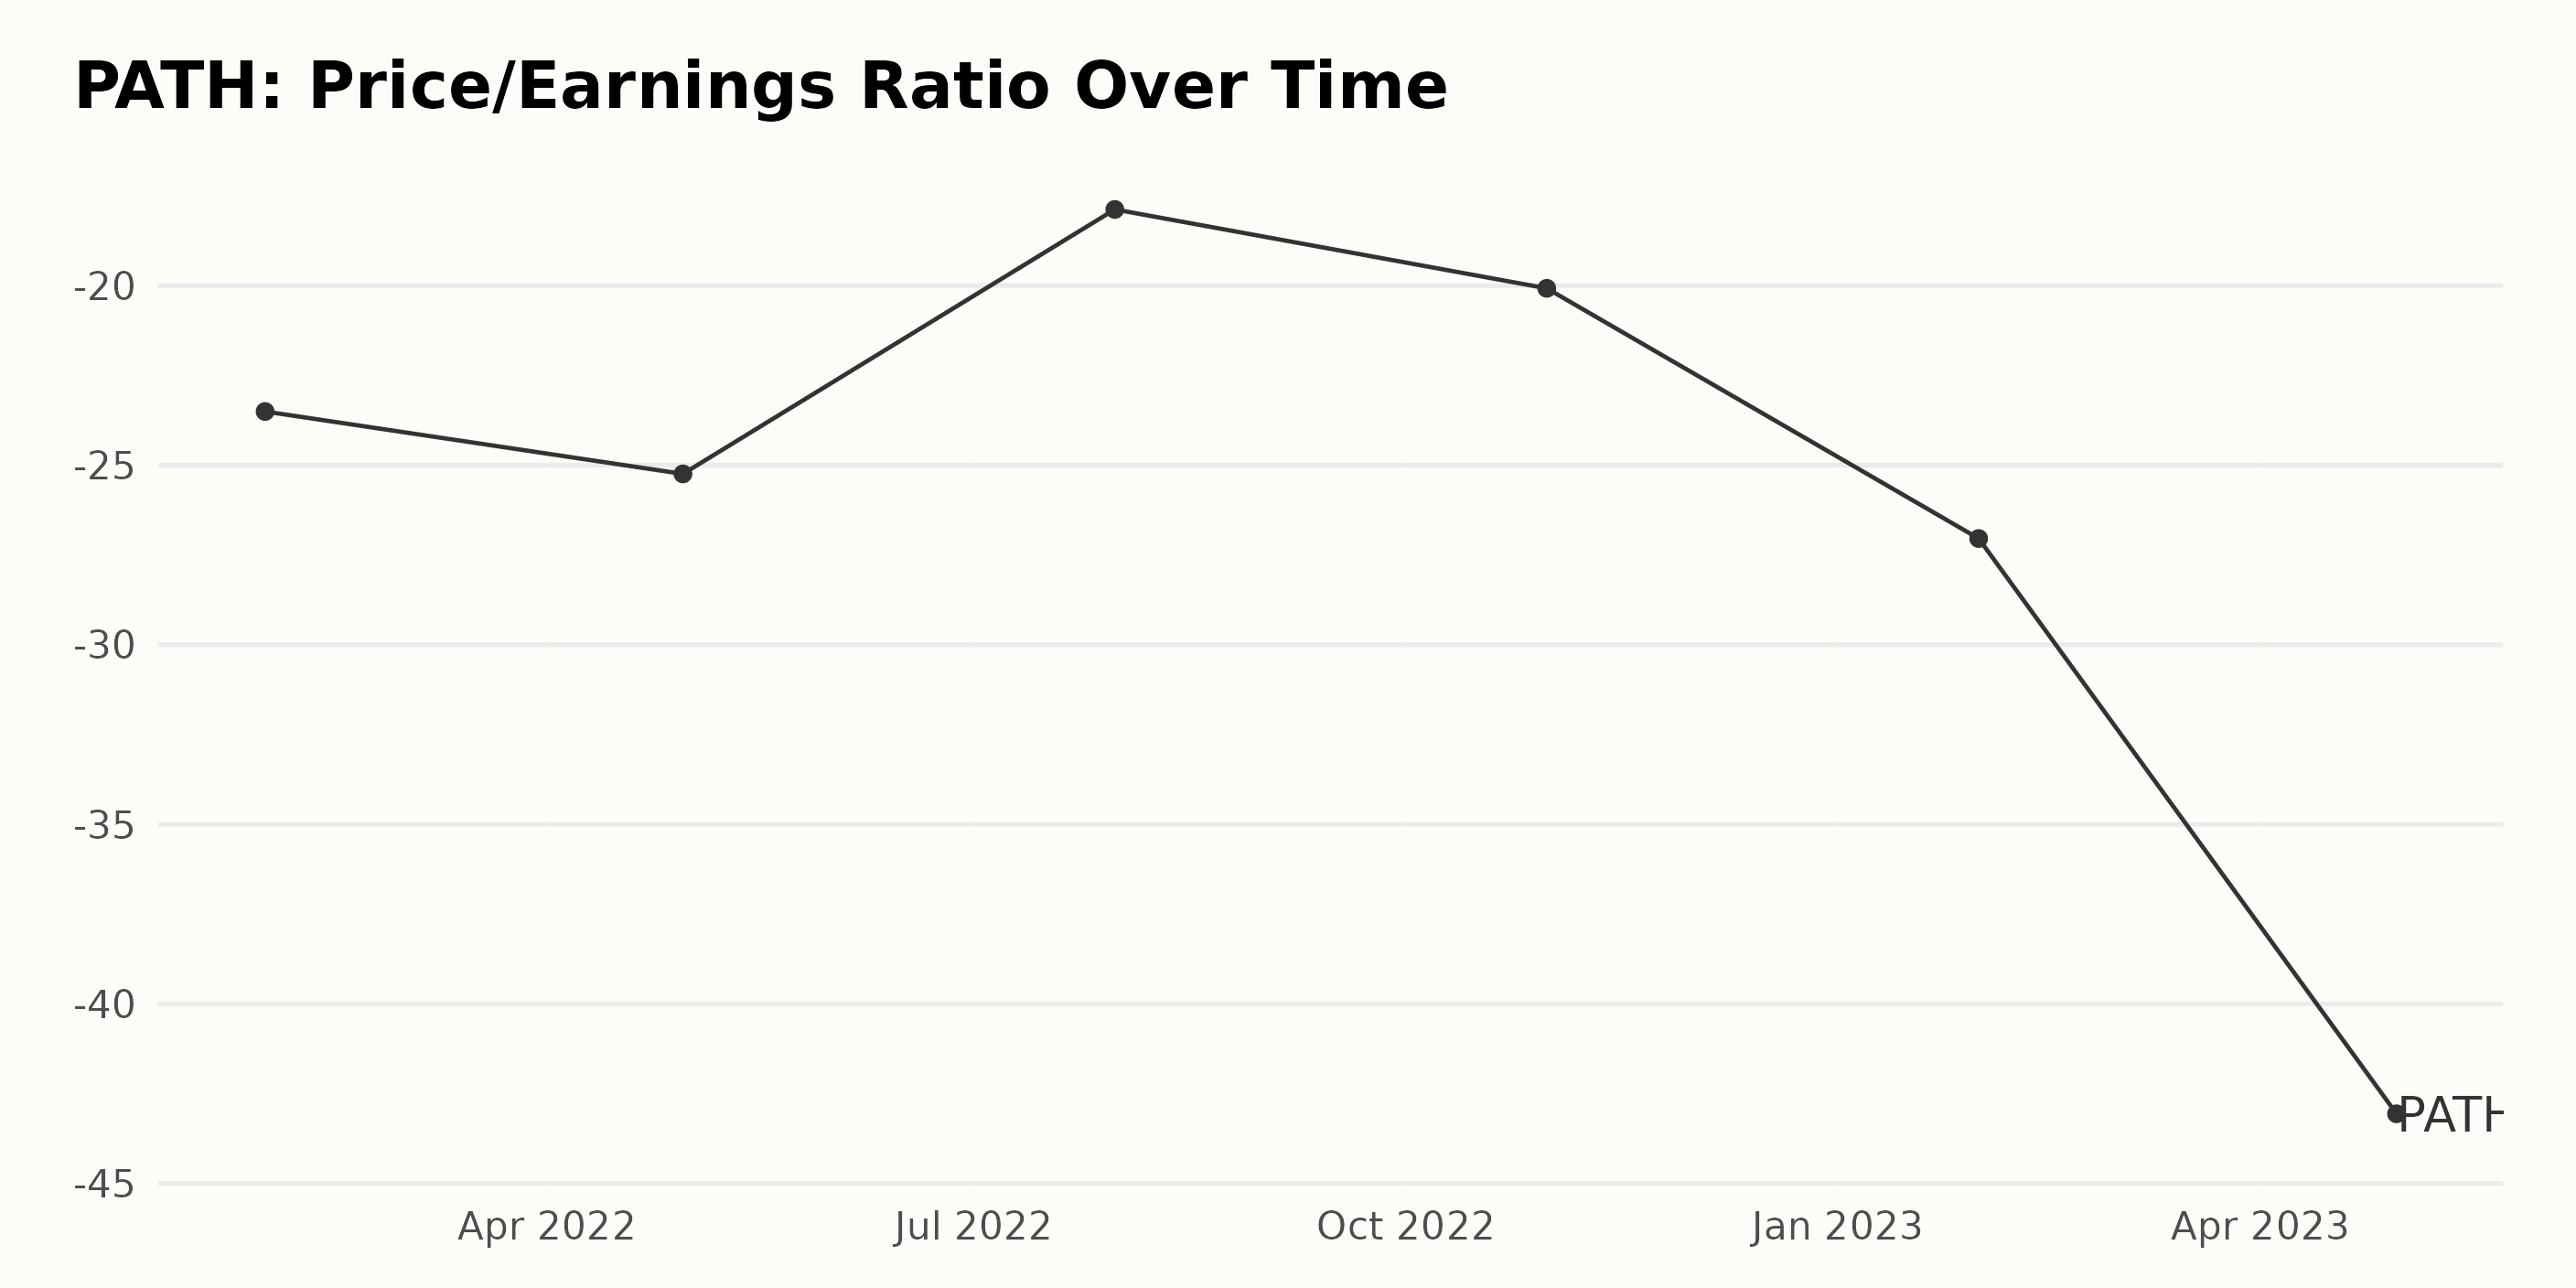
PATH’s Price/Earnings ratio (P/E) exhibits a notable downward trend coupled with fluctuations through 2022 and until mid-2023.
- January 2022: The P/E Ratio started at -23.51.
- April 2022: It dropped slightly to -25.24, representing about a 7% decline.
- July 2022: A significant upturn occurred, with the data indicating a value of -17.88, a growth of approximately 29% from the previous quarter.
- October 2022: However, the gains were lost in the subsequent quarter, with the P/E ratio falling to -20.08, a decrease of about 12% compared to July.
- January 2023: The year commenced with the largest quarterly drop recorded in the series, with the P/E ratio falling sharply to -27.04, showing around a 35% decline from the October 2022 value.
- April 2023: Lastly, the P/E dipped further to its lowest value in the series, coming in at -43.06, representing a substantial decrease of approximately 59% from January 2023.
In summary, across the period under analysis, PATH's P/E ratio decreased by about 83% from -23.51 in January 2022 to -43.06 in April 2023. This pattern signals heightened uncertainty around PATH’s profitability, although the fluctuations denote some periods of recovery.
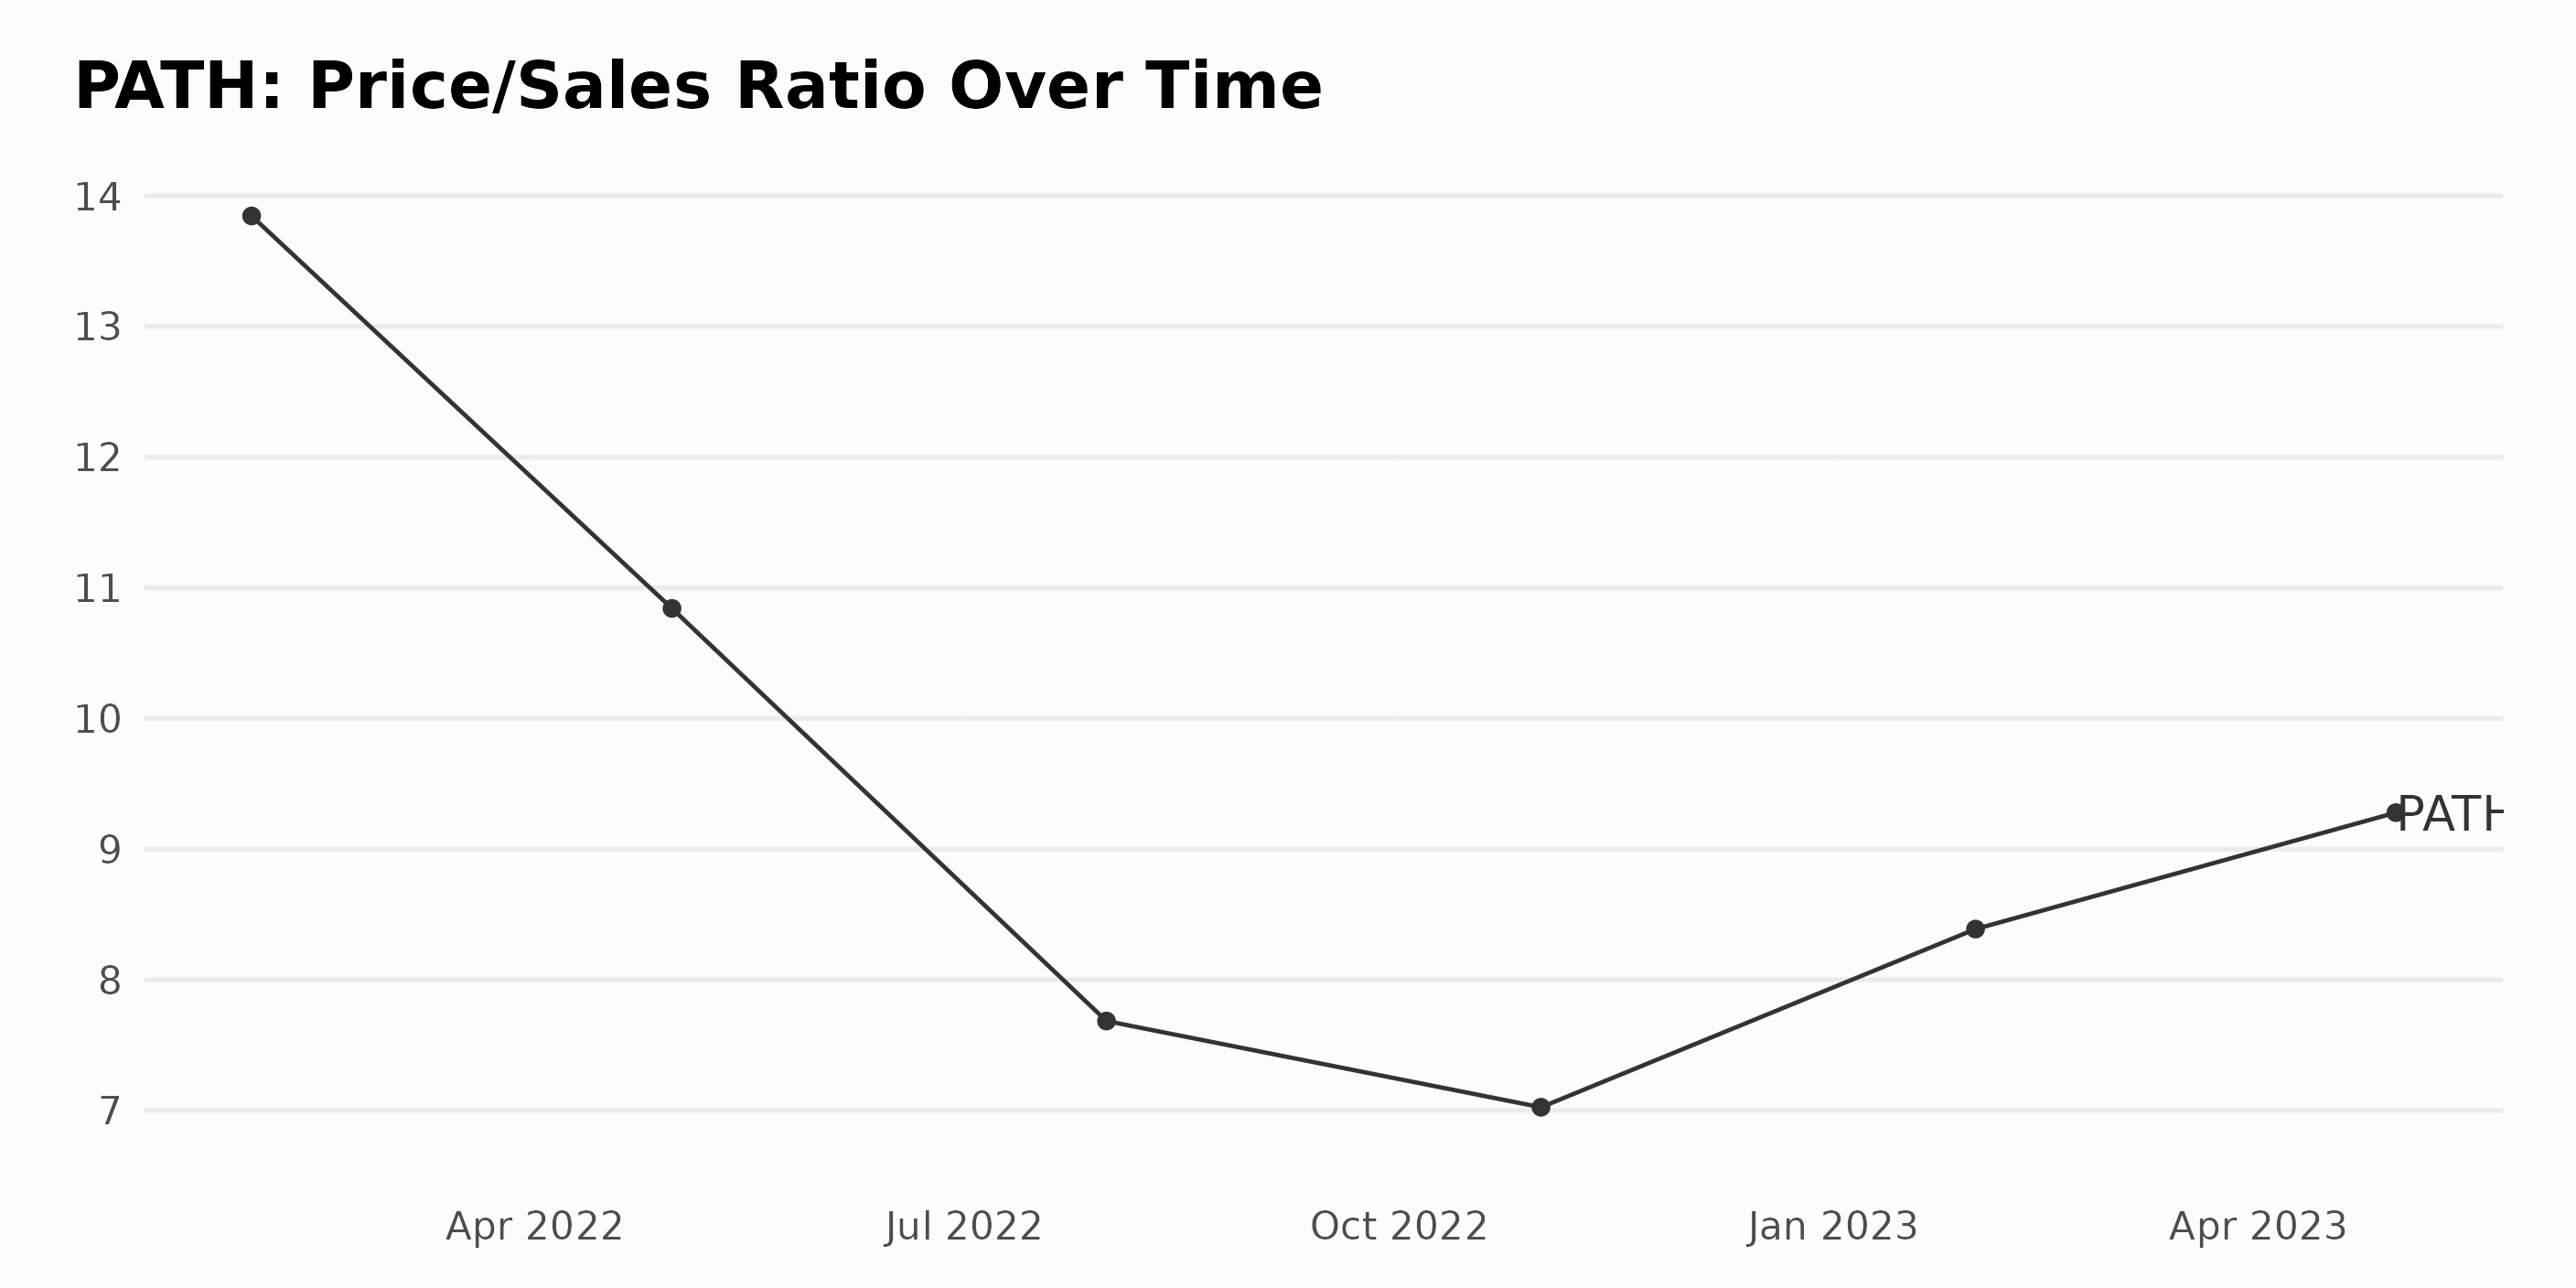
PATH’s Price/Sales ratio has demonstrated a notable trend and oscillations from January 2022 to April 2023. The ratio experienced a significant fluctuation throughout this period.
- January 2022: 13.85
- April 2022: 10.84. This represents a decrease in the ratio, indicating a significant dip.
- July 2022: 7.68
- October 2022: 7.02
- January 2023: 8.39. The previous pattern was reversed, with the ratio climbing back up, indicating an increase since the recorded low in October 2022.
- April 2023: 9.28
Overall, the trend demonstrates an initial decrease from January 2022 through October 2022, and then it shows signs of an upturn from October 2022 through April 2023. The growth rate, measured from the first to the last value, signifies a decrease of around 33%.
Despite the noticeable dip till October 2022, the more recent data support a rebound in the Price/Sales ratio from late 2022 to early 2023. Thus, greater emphasis is placed on these later data points.
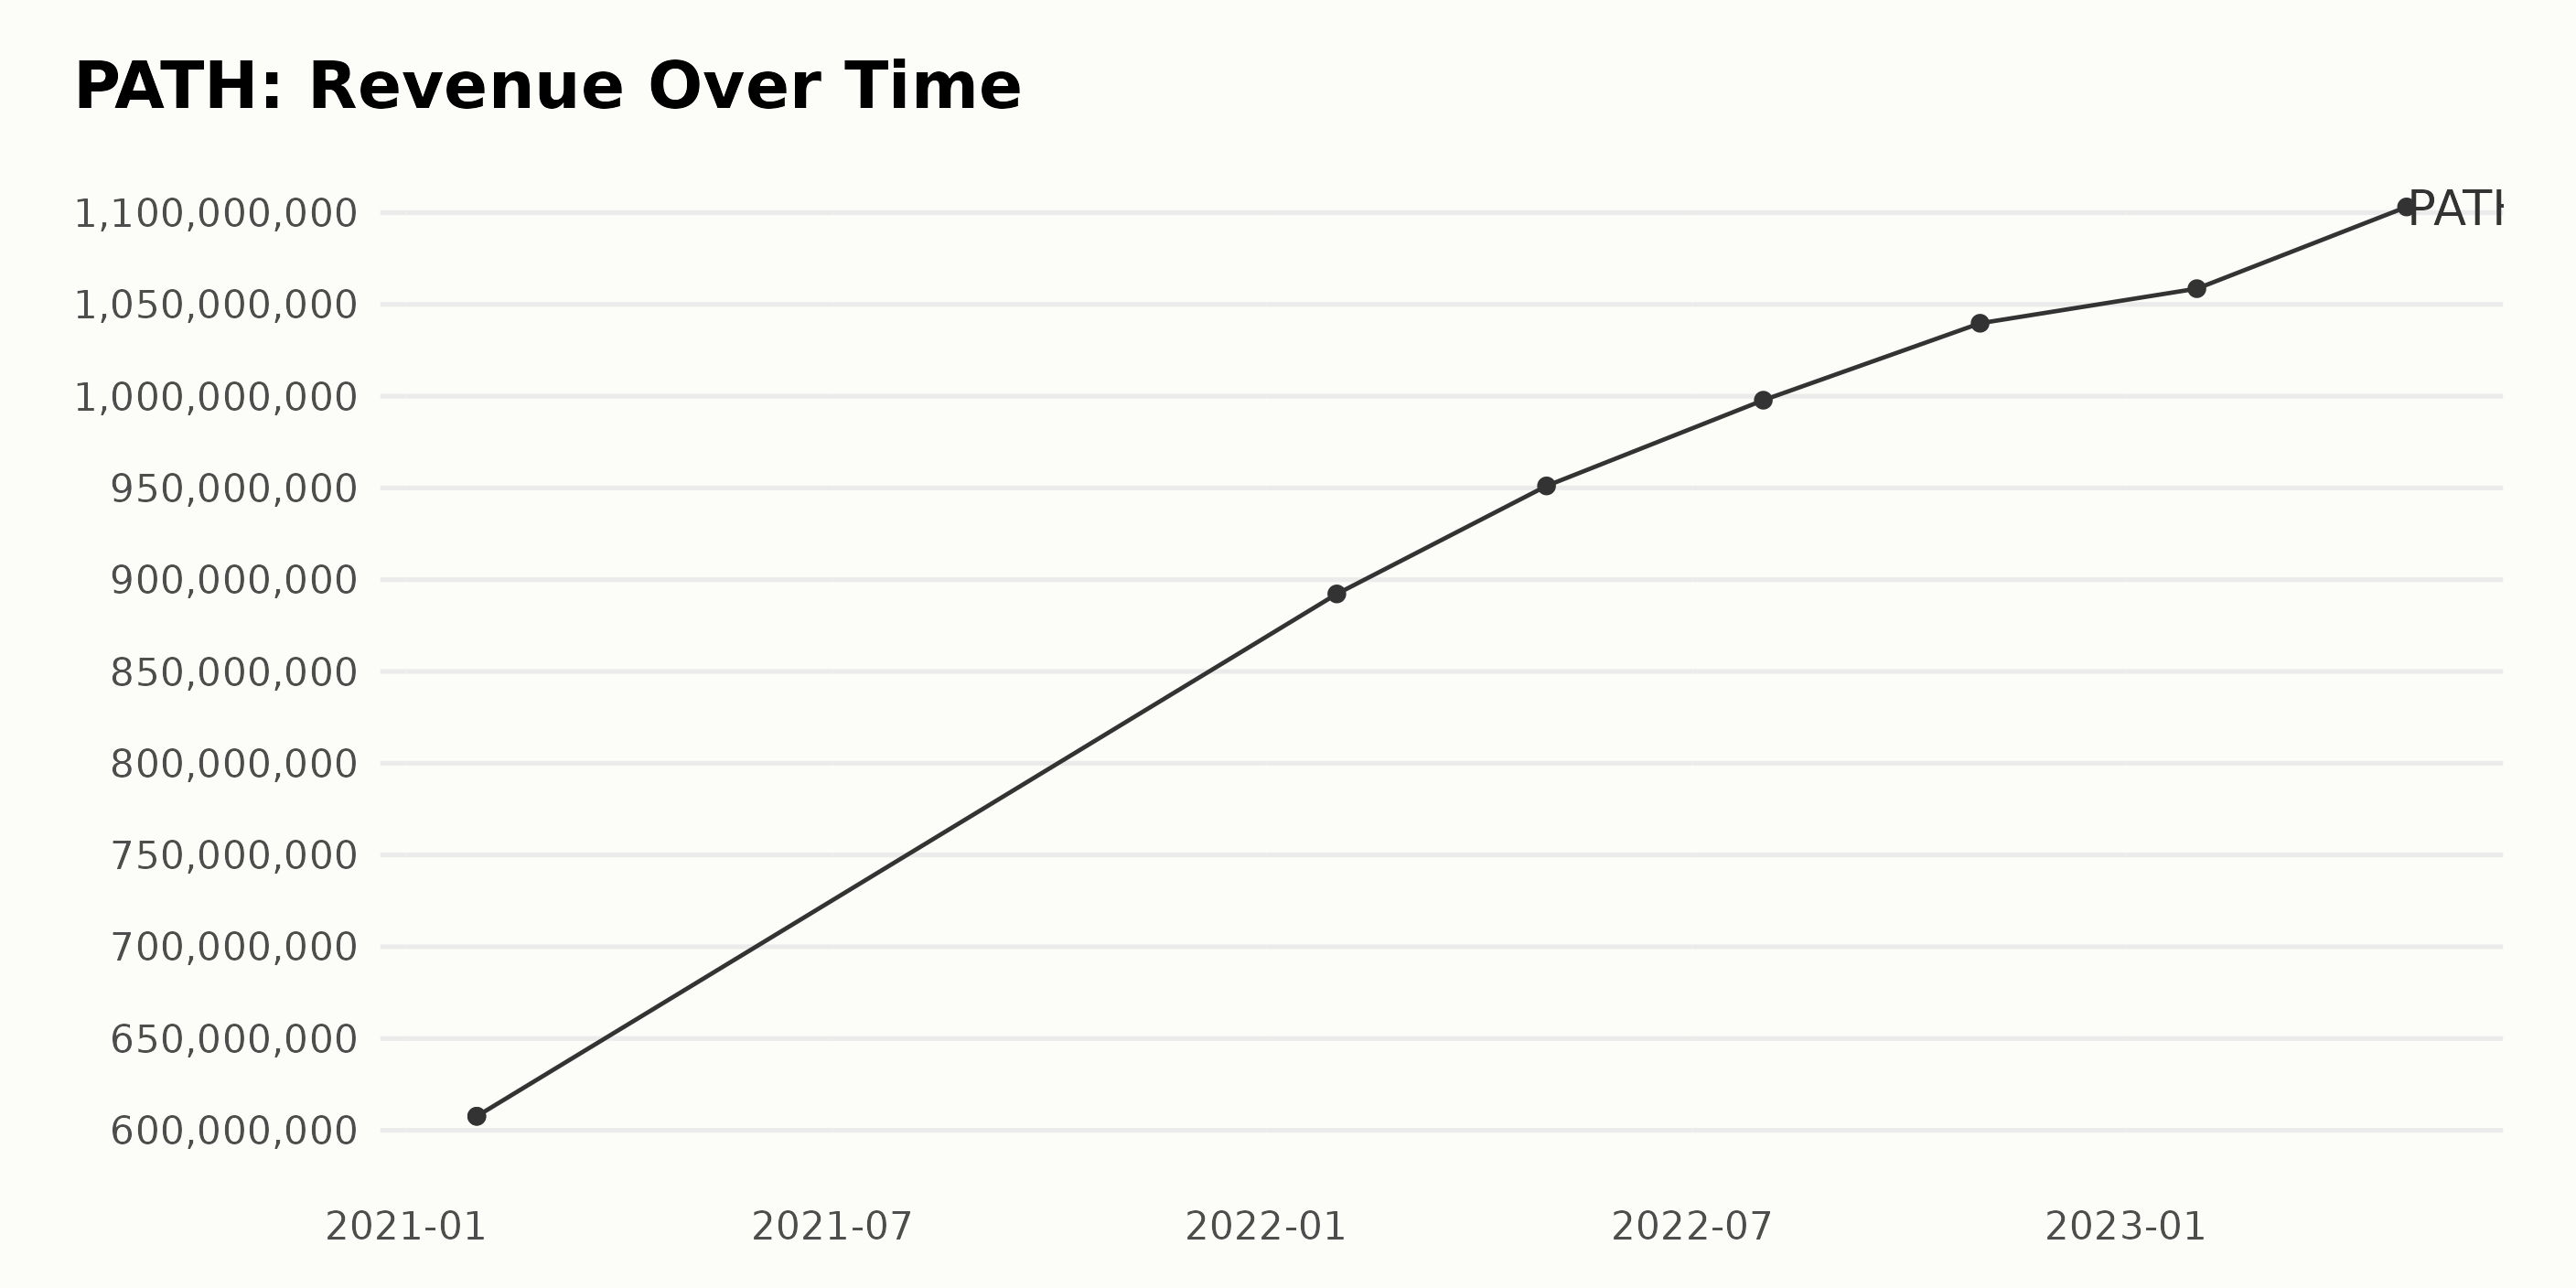
PATH’s trailing-12-month revenue trend and fluctuations can be summarized as follows:
- January 2021: $607.60 million
- January 2022: $892.30 million. This demonstrates a healthy growth rate compared to the previous year.
- April 2022: $951.10 million
- October 2022: $1.04 billion
- January 2023: $1.06 billion
- April 2023: $1.10 billion
From January 2021 to April 2023, PATH's revenues have had a distinct upward trend. The increase in revenue from $607.60 million to $1.10 million calculates to a growth rate of approximately 81.5%, indicating strong financial performance over this period. However, close attention should be paid to future reports to monitor whether the rise in revenue continues.
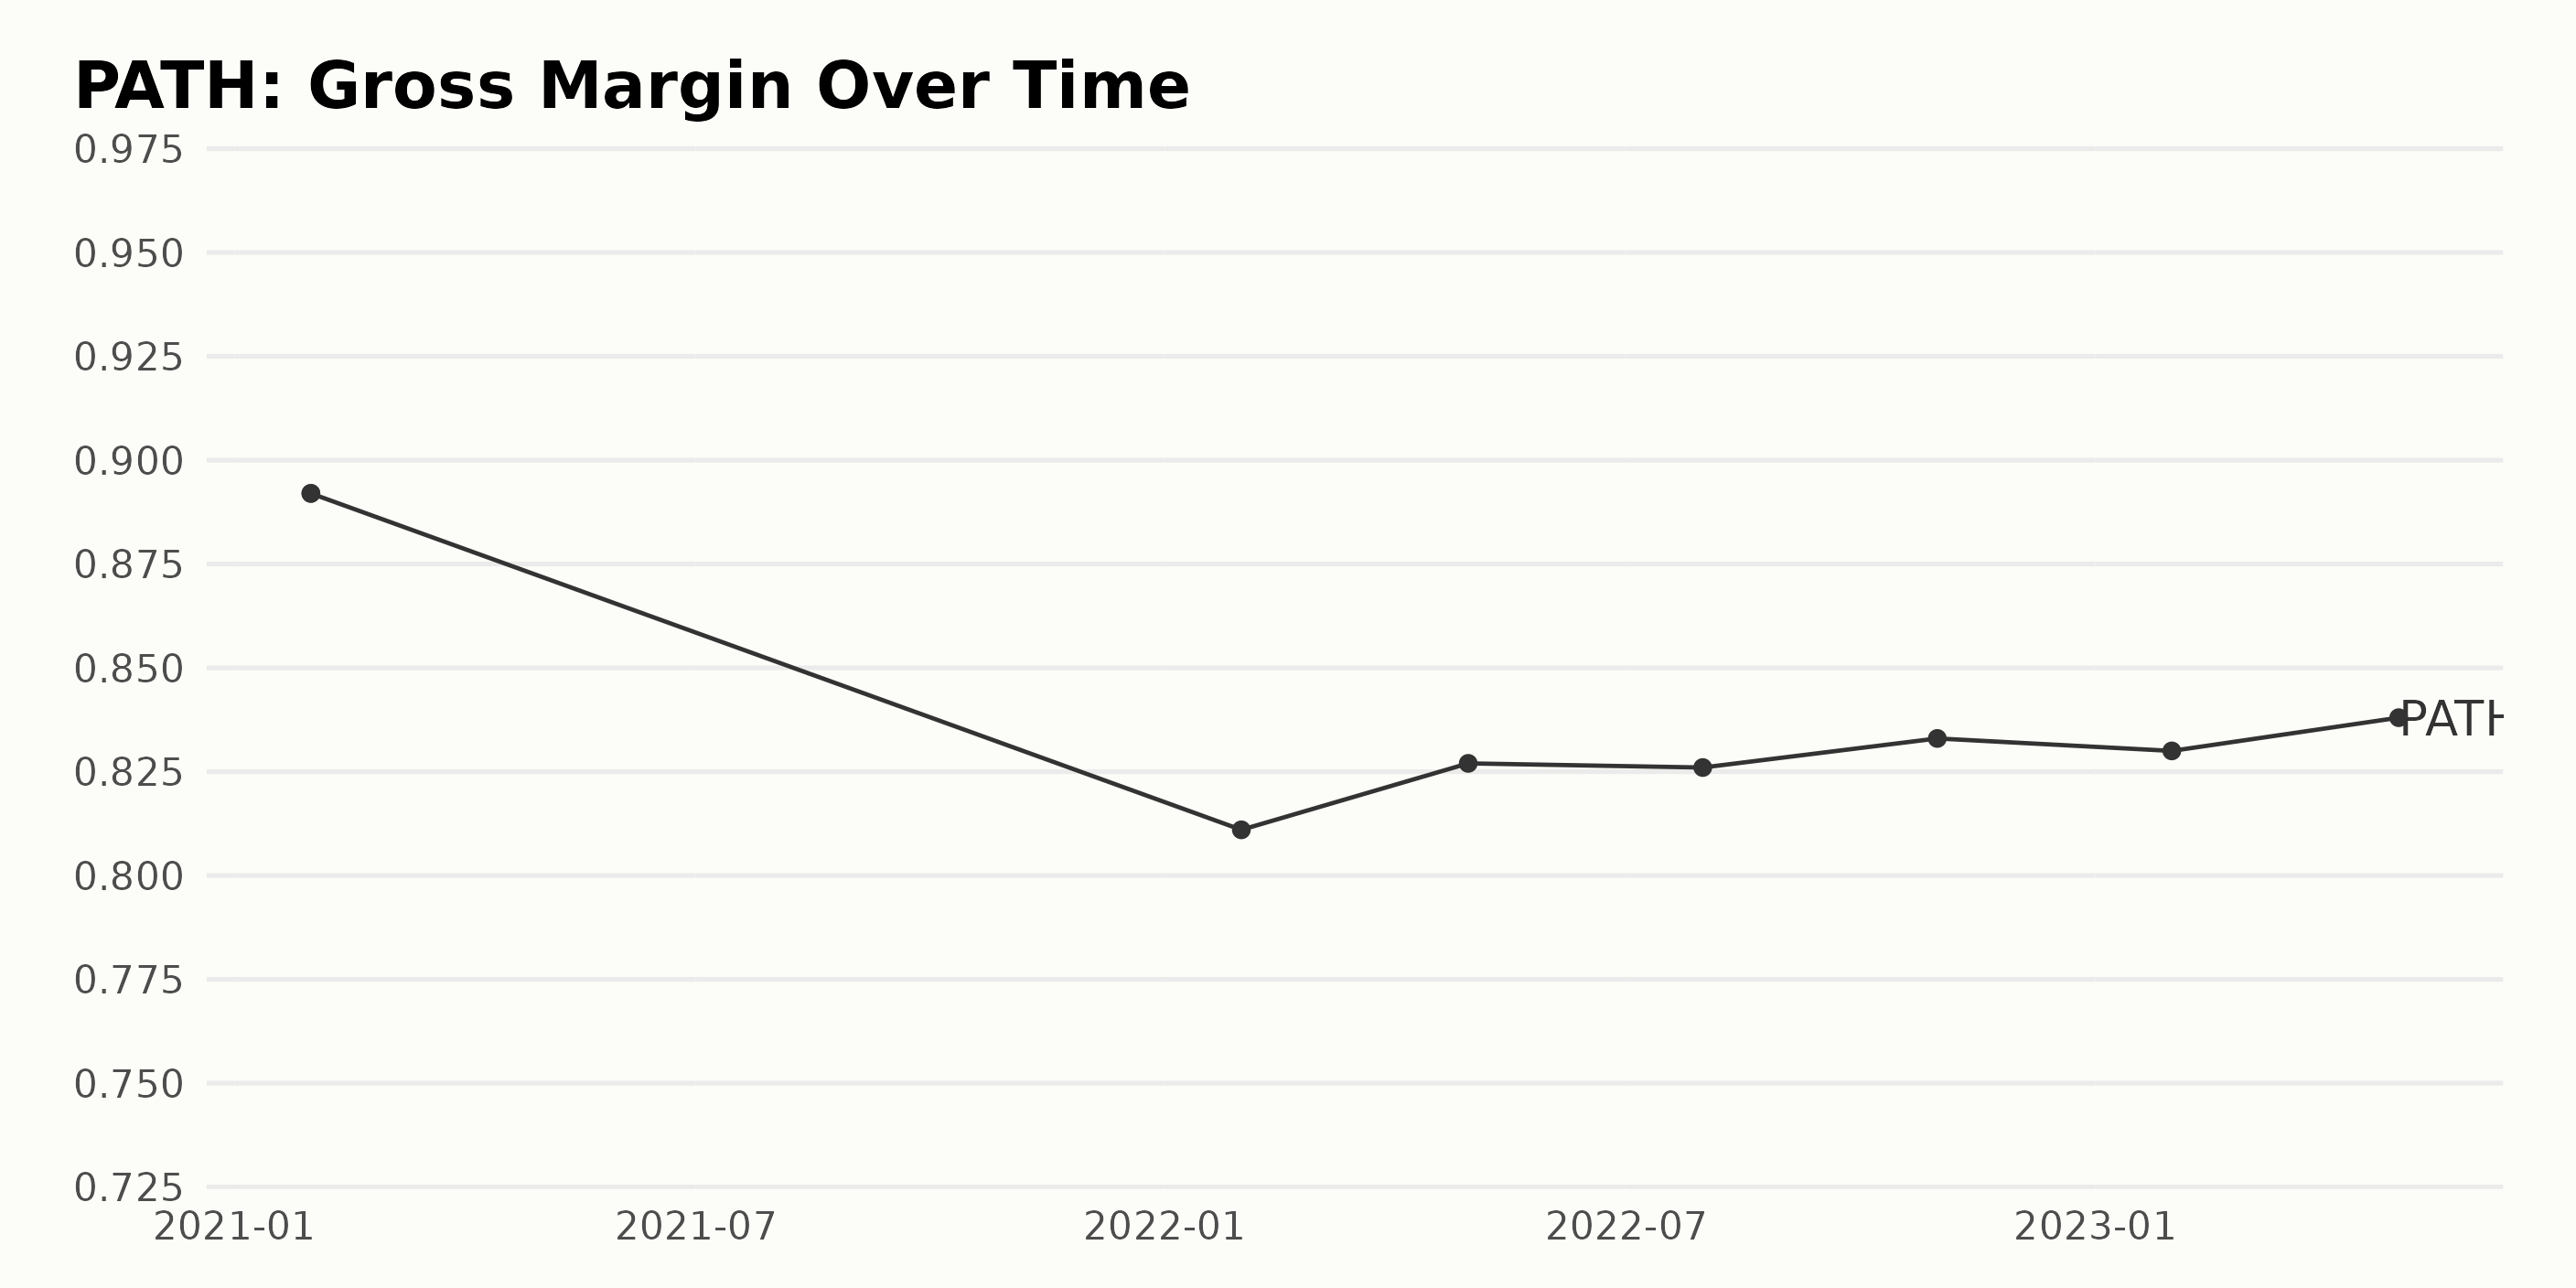
PATH’s gross margin has seen both highs and lows over the past two years, demonstrating a decline at certain points, followed by a gradual resurgence.
- In January 2021: The gross margin was at its peak, standing at 89.2%
A downward trend was observed through early 2022:
- By January 2022: Dropped to 81.1%
- April 2022: 82.7%
- July 2022: 82.6%
A slight increase followed in late 2022:
- October 2022: 83.3%
Early 2023 started on a somewhat promising note, albeit with a marginal dip:
- January: 83%
- April: 83.8%
Notably, from the data's first value in January 2021 to its last value in April 2023, PATH's gross margin showed an overall decline. Considering these points in time, the growth rate reflects a decrease of approximately 6%.
In the last six months (November 2022 to April 2023), PATH’s gross margin fluctuated slightly but mostly inclined upwards. It stood at 83.3% in November 2022, dipped slightly to 83% in January 2023, and then rose to 83.8% in April 2023. It indicates the possibility of an upward trajectory for PATH's gross margin in the coming months, although it's still lower than the initial record of 89.2%.
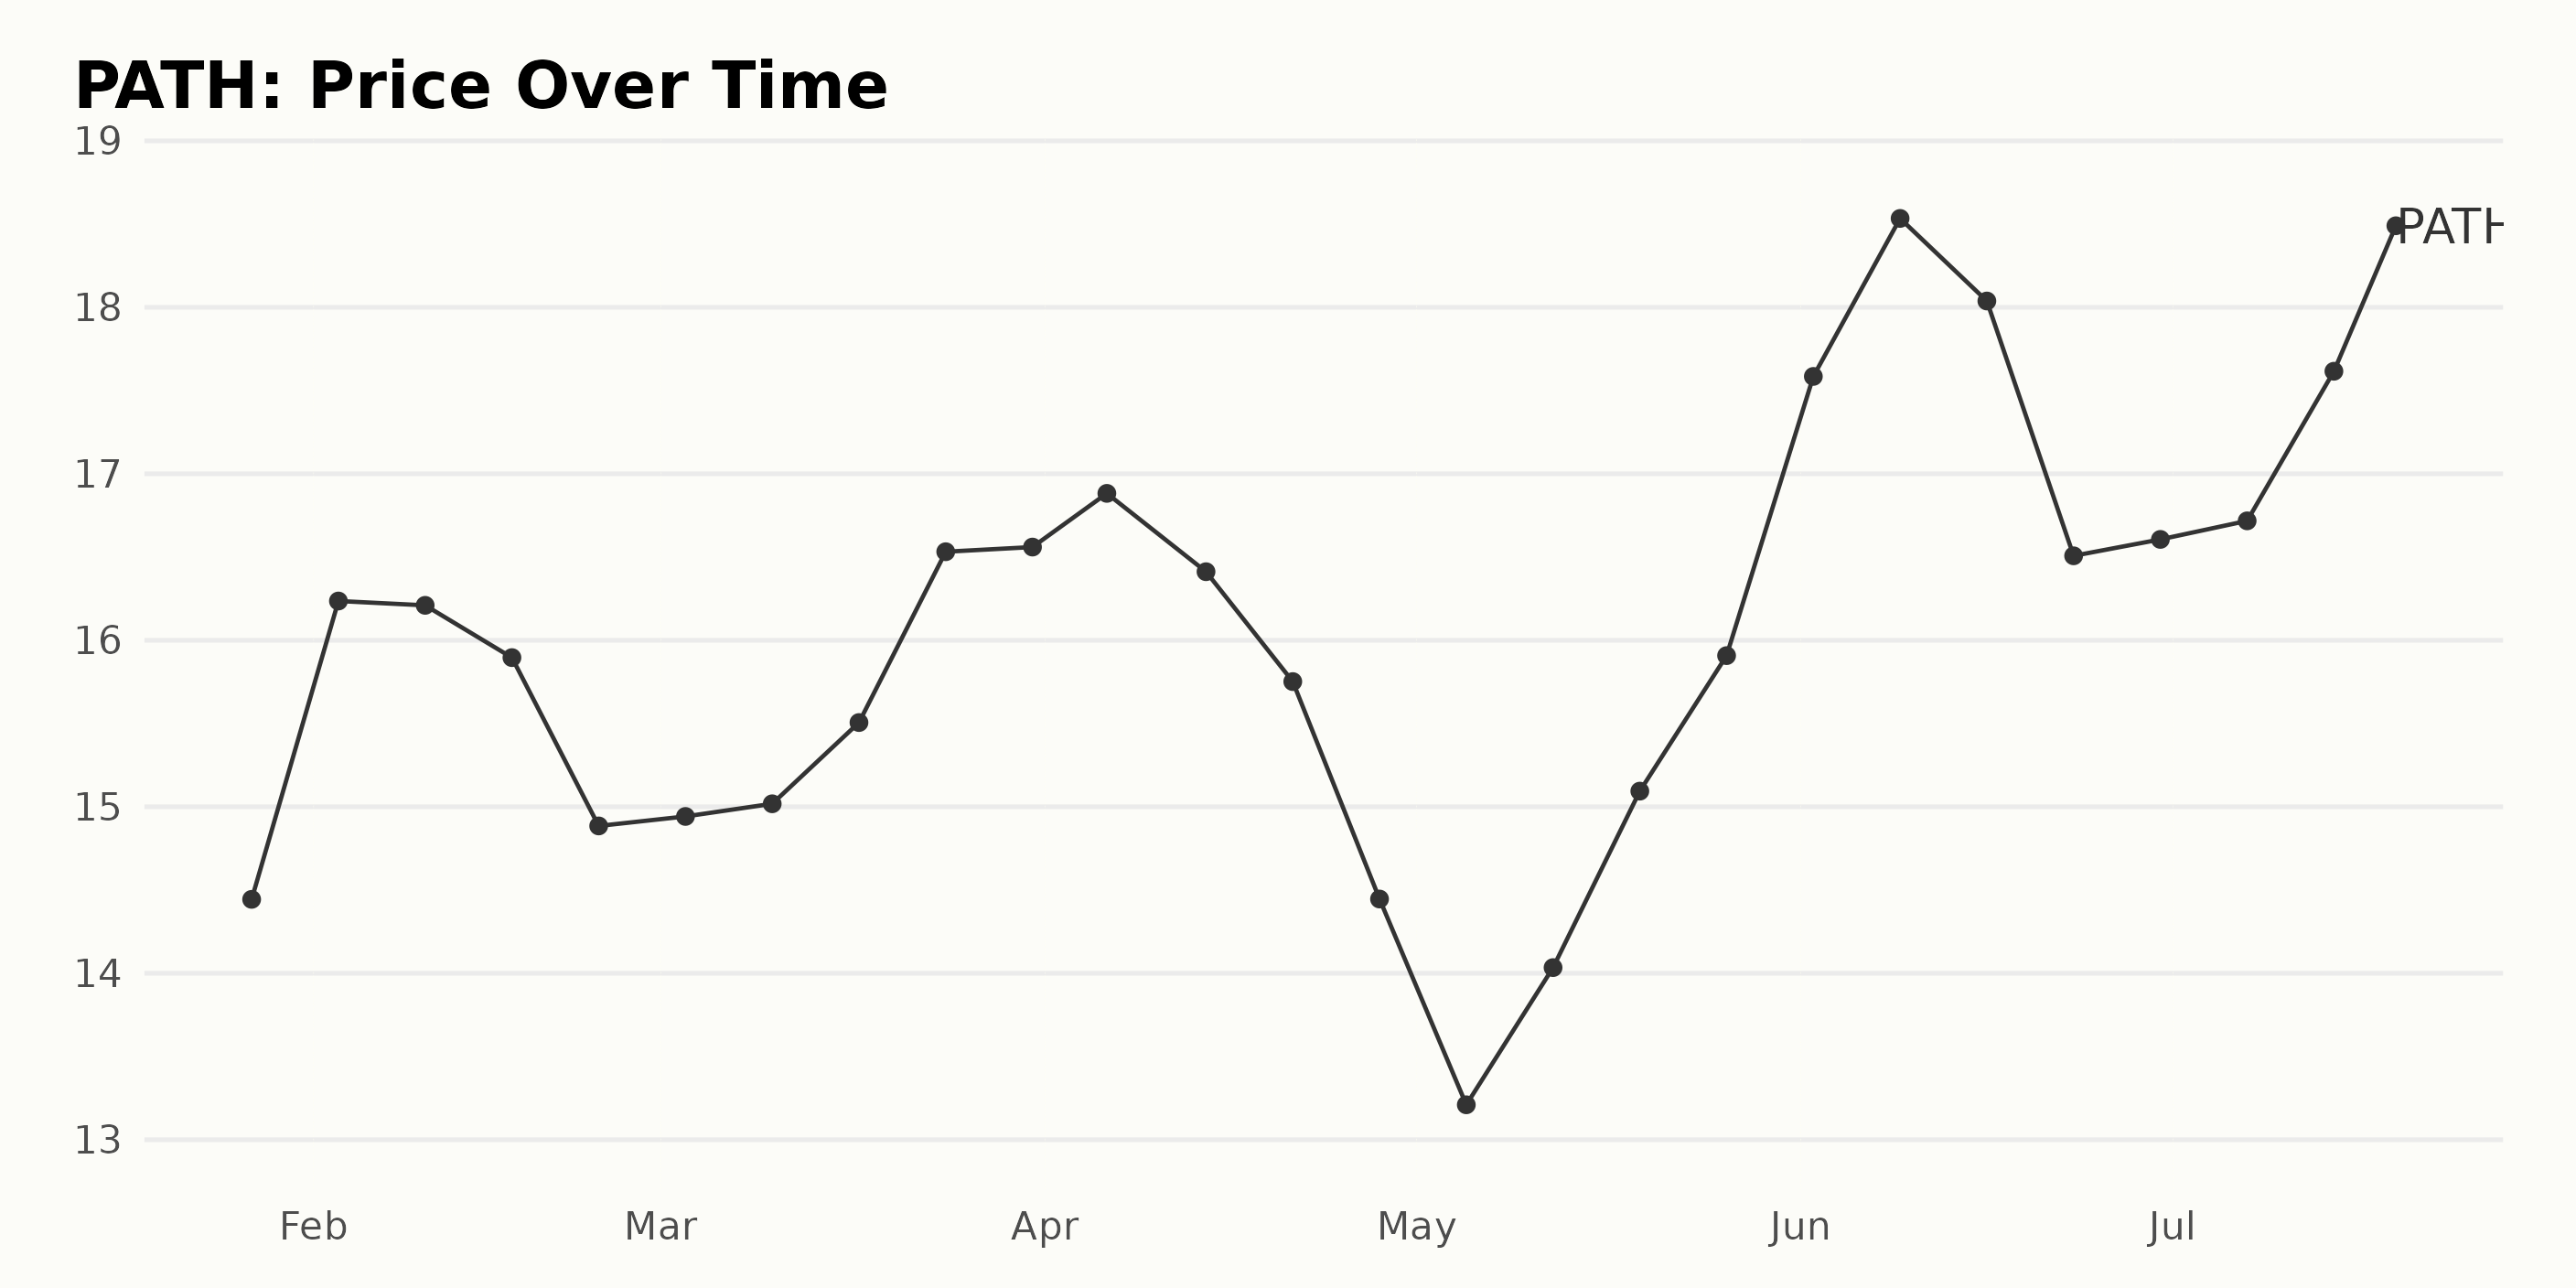
Fluctuating Journey: Detailed Review of PATH’s Share Price Trends in 2023
Reviewing the provided data, here are the key observations on the trend and growth rate of PATH’s share prices:
- On January 27, 2023, at a price of $14.44, there was a surge in the share price to $16.24 by February 3, representing a growth rate of about 12.4%.
- However, from February 10 to February 24, 2023, the share price shows a decreasing trend, with a fall from $16.21 to $14.89.
- The share prices demonstrated a mild steady increase throughout March 2023, starting at $14.94 on March 3 and finishing the month at $16.56, accounting for a growth rate of approximately 10.8%.
- April 2023 highlights volatility with an escalating trend in the initial week peaking at $16.88, immediately followed by a substantial drop to $14.45 by the end of the month.
- In May, the share price revealed a V-shaped trend. It dips to its lowest, $13.21, on May 5 and then ascends to $15.91 by May 26.
- There is significant growth observed in June, with the share price reaching the highest point for the year at $18.53 on June 9. After this rise, it decelerated to $16.51 on June 23. Yet, it picks up slightly, closing June at $16.61.
- In July, the shares maintained a stable, rising trend throughout, kicking off the month at $16.72 and hitting one more peak for the year at $18.49 on July 19.
Overall, the trend line of the share price depicts a broad 'W' shape across these months, with significant fluctuations observed during April and May. The rapid increase during June can be noted as the accelerating pace in share price growth.
Conversely, the immediate slowdown following this period indicates a decelerating trend. Notably, despite these downturns, the overall momentum appears to be increasing, as evidenced by the higher figures at the end of the observation period compared to the starting point. Here is a chart of PATH's price over the past 180 days.
Analyzing PATH’s POWR Ratings: Growth, Quality, and Momentum
The overall POWR Ratings grade of PATH in the B-rated Software - SAAS category has been fluctuating over time. As of the latest available data on July 19, 2023, PATH’s overall POWR Ratings grade is a C, equating to Neutral, with its rank in the category being #18 out of 25 stocks. Here is an overview of its progression:
- From January 21, 2023, up until February 11, 2023, the POWR grade was D (Sell), with a rank in category consistently at #23.
- On February 18, 2023, a slight improvement was noted, with a rank of #22, though the POWR grade remained at D (Sell). Subsequently, by the end of February 2023, the rank fell back to #23.
- In March 2023, there was a noticeable improvement, with the POWR grade increasing to C (Neutral) and the rank in category improving to #21 by March 18, 2023, further enhancing to #20 by March 25, 2023.
- The upward trend continued into early April 2023, with the rank improving to #19 by April 1, 2023. However, for the remainder of April, the rank hovered at #20 while the POWR grade dipped back to D (Sell) on April 29, 2023.
- Beginning in May 2023, the POWR grade rebounded to C (Neutral) and maintained this through June 2023. Over this period, the rank in category fluctuated between #22 and #17, showing a trend of gradual improvement.
- To conclude, at the most recent data point, as of July 19, 2023, the POWR grade remains at C (Neutral) with a rank of #18 out of 25 stocks in the Software - SAAS category, signaling a continuing modest upward trend.
Despite PATH’s mixed pattern, frequently bouncing between the D (Sell) and C (Neutral) POWR grades, there seems to be a general improvement in rank within its category. However, it still sits in the lower range relative to the total number of stocks. This tells us that PATH is faring relatively less successfully when compared to other stocks in the Software – SAAS category.
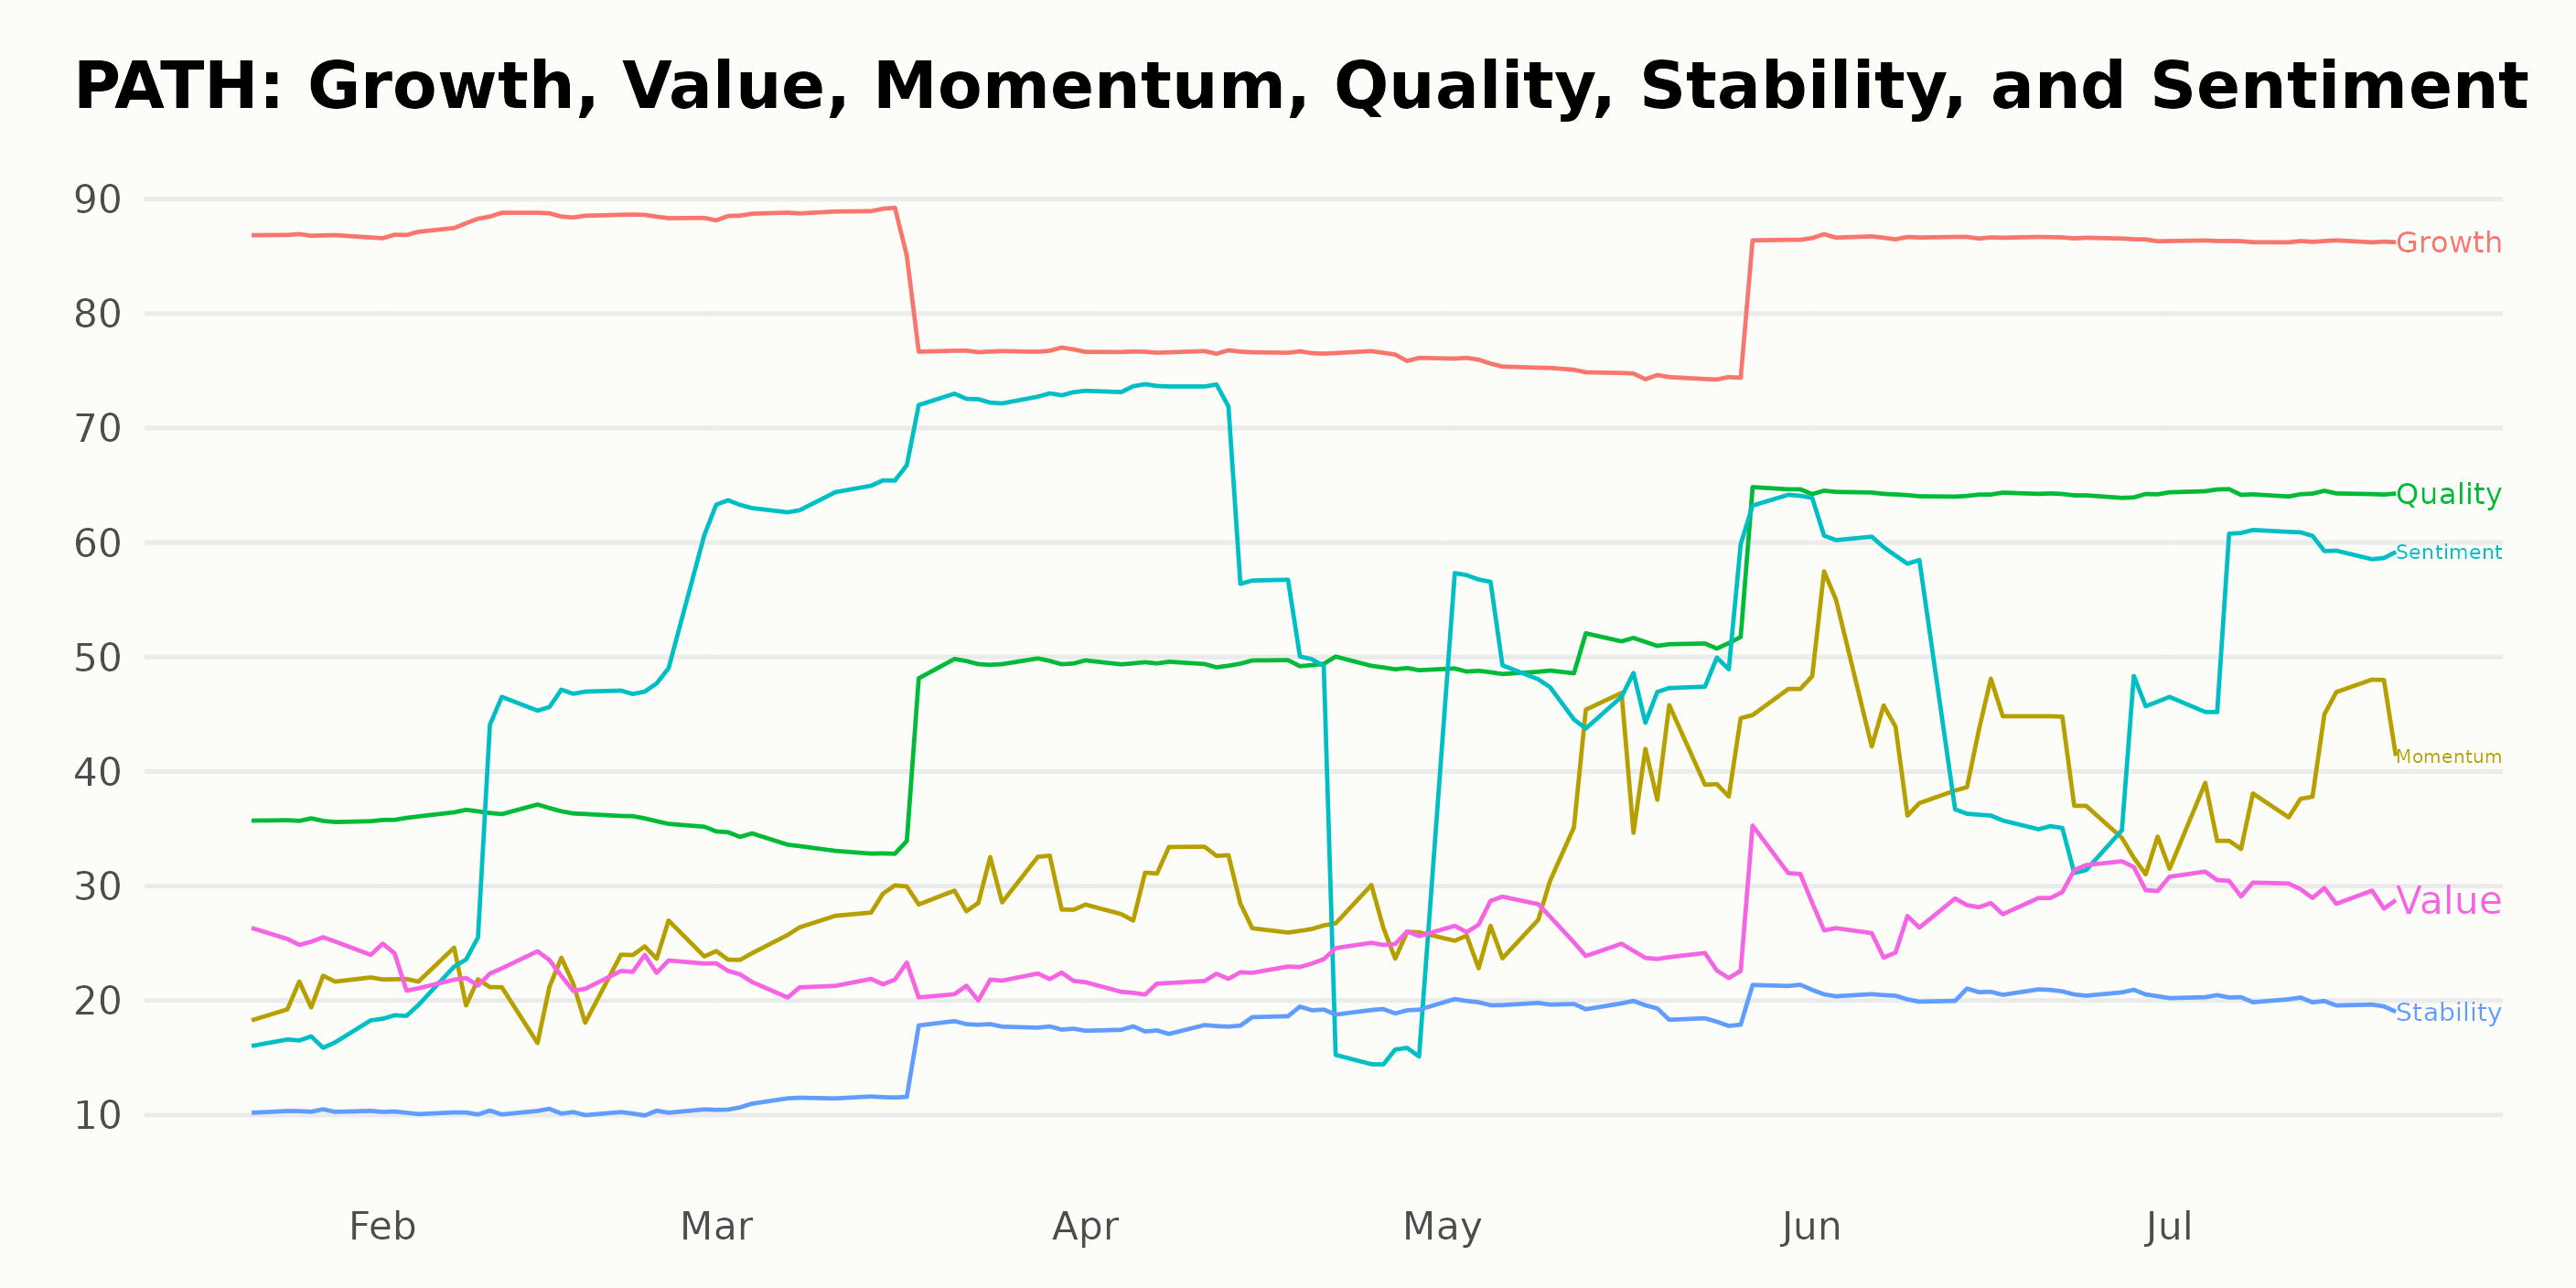
The three most noteworthy dimensions in the POWR Ratings for PATH are Growth, Quality, and Momentum. Here is the summary of the PATH’s POWR grade and rank in the category:
Growth - The growth dimension consistently secured relatively high ratings throughout the year.
- January 2023: 87
- February 2023: 88
- April and May 2023: 77
- June 2023: 87
- July 19, 2023: 86
Quality - The quality dimension displayed a clear upward trend over this period.
- January 2023: 36
- July 19, 2023: 64
Momentum - Momentum also showed a definite increasing trend.
- January 2023: 21
- June: 42
- July 19, 2023: 39
How Does UiPath, Inc. (PATH) Stack Up Against Its Peers?
While PATH has an overall grade of C, equating to a Neutral rating, check out these other stocks within the Software - SAAS industry: The Sage Group plc (SGPYY), Informatica Inc. (INFA), and MiX Telematics Ltd. ADR (MIXT), with a B (Buy) rating.
43 Year Investment Pro Shares Top Picks
Steve Reitmeister is best known for his timely market outlooks & unique trading plans to stay on the right side of the market action. Click below to get his latest insights…
Steve Reitmeister’s Trading Plan & Top Picks >
PATH shares were trading at $17.72 per share on Thursday afternoon, down $0.77 (-4.16%). Year-to-date, PATH has gained 39.42%, versus a 19.74% rise in the benchmark S&P 500 index during the same period.
About the Author: Sristi Suman Jayaswal

The stock market dynamics sparked Sristi's interest during her school days, which led her to become a financial journalist. Investing in undervalued stocks with solid long-term growth prospects is her preferred strategy. Having earned a master's degree in Accounting and Finance, Sristi hopes to deepen her investment research experience and better guide investors.
The post Is UiPath, Inc. (PATH) Becoming the Next Hot Software Stock to Buy? appeared first on StockNews.com