


As most long time Reitmeister Total Return members know, I do an annual Lessons Learned edition in December. This is an important habit because if we do not learn from the mistakes of the past...we are doomed to repeat them!
However, there are some important lessons that I want to share now while they are still fresh in my mind. Namely about when to switch from bearish to bullish (and vice versa). So, lets jump right into that timely topic in the commentary below...
Market Commentary
Market timing has become much harder. There is simply less adhesion to the trends of the past given the growth of computer based trading versus decisions made by people on the fundamentals displayed through a prism of emotions (fear & greed).
The problems of market timing do not end there. Unfortunately, fundamentals are not full proof either.
As an Economics major I begrudgingly admit that its a soft science...as in not very exact. That is why you can get 5 economists together to review the data and come out with 5 different opinions of what comes next.
More specifically to the most recent events...the bear market unfolded in 2022 because of the historical relationship between high inflation so often bringing on the next recession.
Then an odd thing happened. No recession unfolded.
As we look in the rear view mirror it is much easier to understand why. That being 2-4 million baby boomers selecting early retirement in the face of Covid. This paved the way for historic low unemployment rate that would not crack even 17 months after the Fed started raising rates.
It is for these reasons that many professionals will NOT attempt market timing no matter how dark the storm clouds appear. They believe the future economic events are simply unknown and unknowable.
Once again, I begrudgingly have to admit that to be true more often than not. However, I can not just stand in front of a freight train taking losses if and when a bear market unfolds.
Gladly, as I honestly review my investing lessons learned going back to 1980 I do see a more reliable market timing approach.
Many who follow my writing will not believe what is about to come out of my keyboard...but here it is.
Price action is a much more reliable means of market timing than fundamentals. In particular, a focus on the 200 day moving average (AKA the long term trend line).
When you boil it down, it is wise to be bullish above the 200 day for the S&P 500 (SPY). And to be bearish under that mark.
Let’s now review some charts to prove the point starting with the onset of the 2022 bear market:
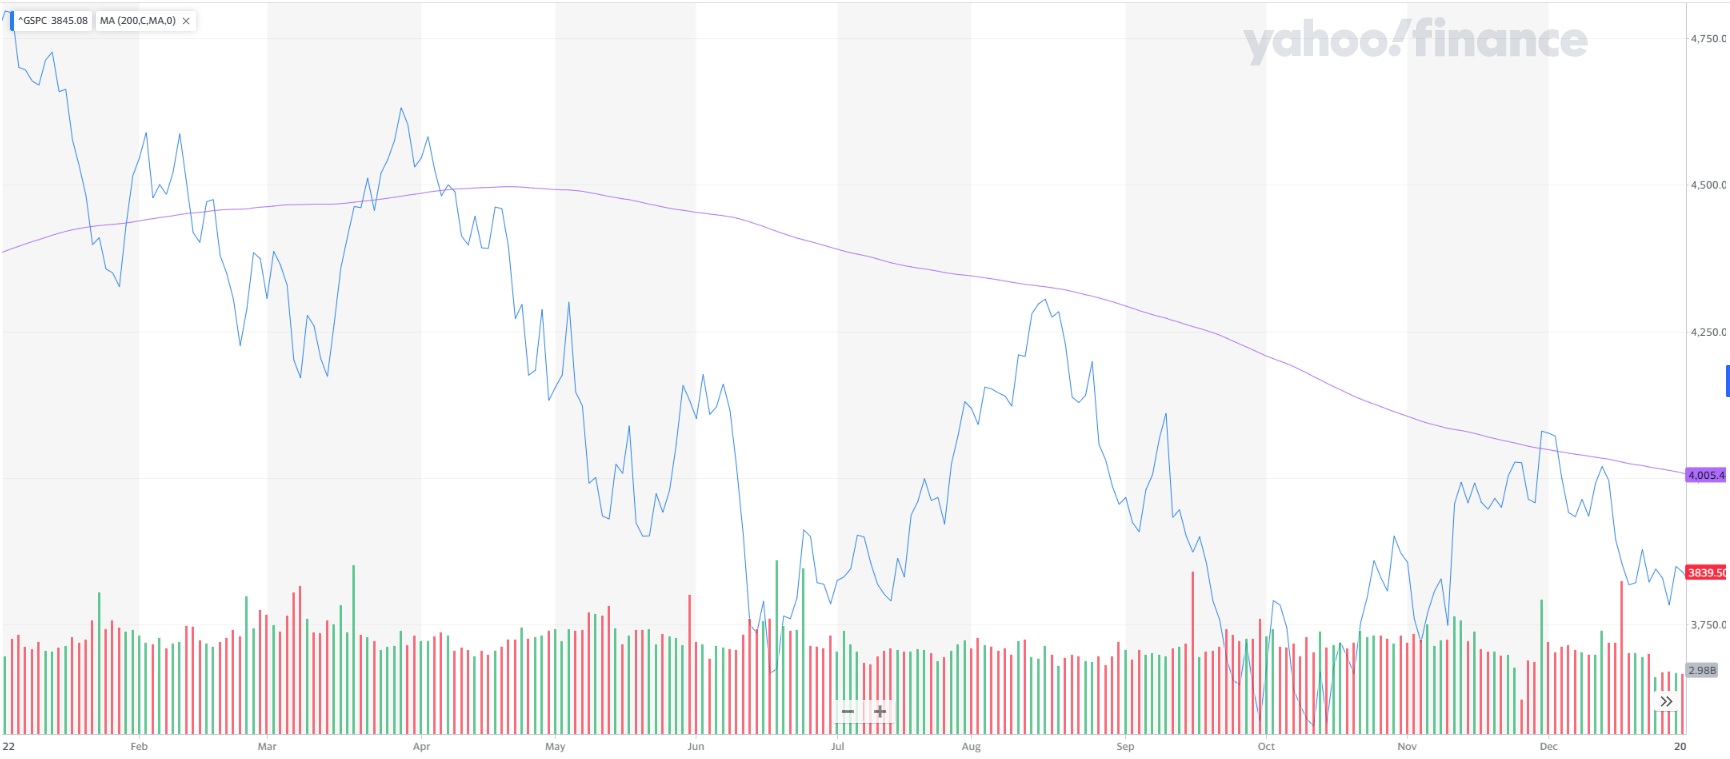
Some people may argue what designates a true break below. Like how many sessions closed below the mark it truly takes to signal more ominous things to come. But even if an investor got bearish on the first break below this level in January 2022 around 4,400, they would have been well served as stocks descended another 20% to the lows of October.
Plus, you can see how many times the market tried to break above the 200 day and failed. Meaning that investors were well served staying bearish as long as the overall market was below that 200 day moving average.
Now let’s move on to the 2023 picture:
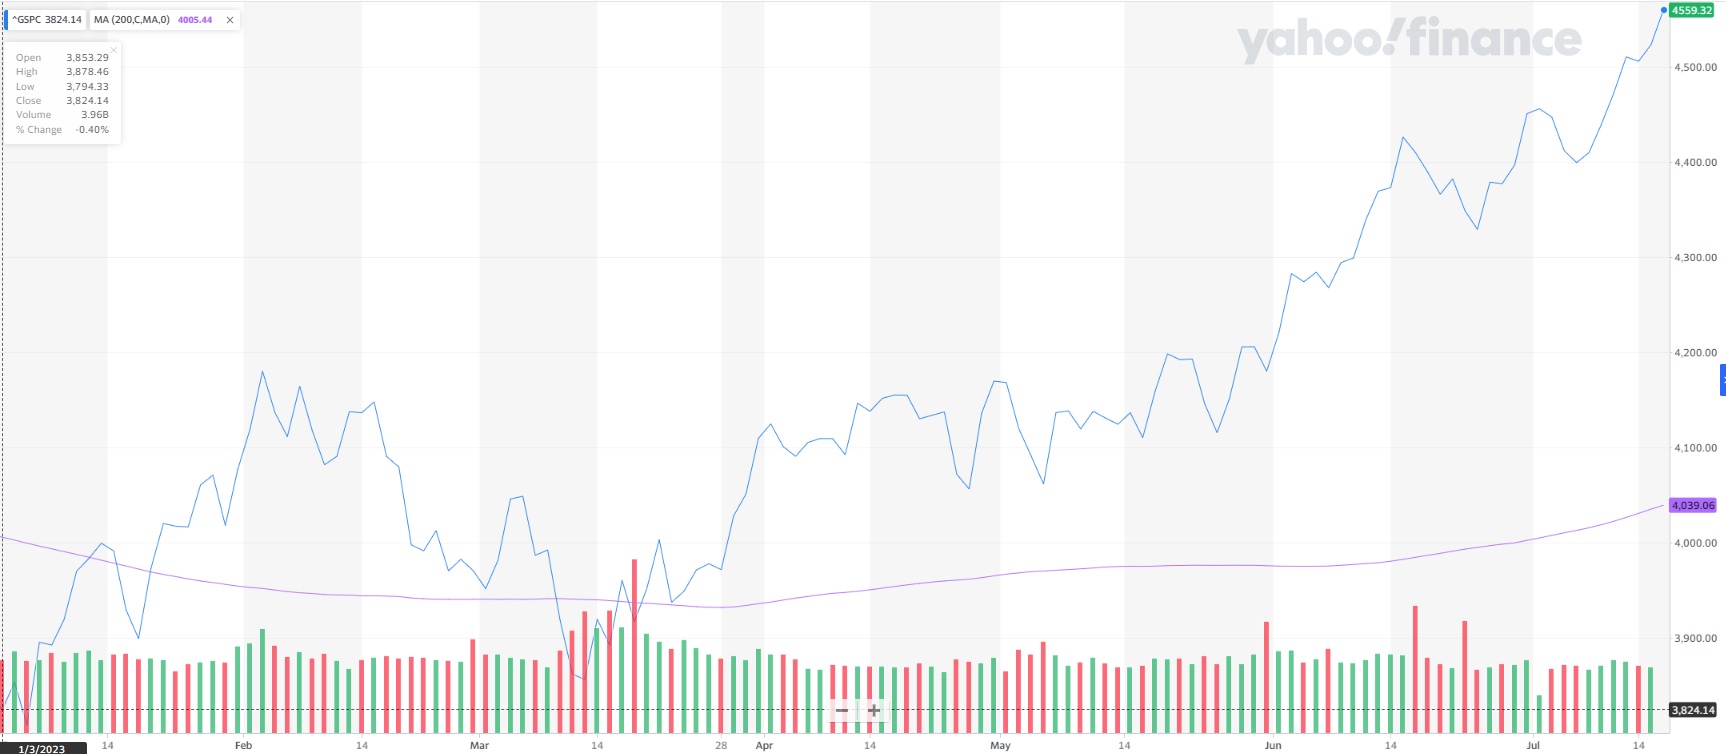
Here too we see a breakout above in early January 2023 just below 4,000. Investors getting more bullish on that note have seen an ample rise up to Tuesday’s new 52 week high at 4,555.
Yes, there were some scary moments in March when there was a rash of banking failures that got stocks below the line for a short while. Yet by early April that was a distant memory before going on an extended bull run.
I am not going to show every time period in history to prove my point. But rest assured I have put my own thought process under a microscope. Putting all ego aside I realized that when I chose my view of fundamentals over the 200 day moving average...I was on the wrong side of history.
In the most recent example, I moved from a bearish hedge to a 50% long portfolio to start April when the market was about 2% above the 200 day moving average. This came in the form of using our coveted Top 10 Small Cap screens that lived up to the billing with a strong period of outperformance.
This 50% invested in stocks approach was better than some investors who clung to the bearish narrative. Yet in retrospect I would have been better served moving to 100% by mid April thereafter given the time and distance the market moved above the 200 day trend line.
This is especially true in our case with such a tremendous advantage on our side with the stock selection prowess of the POWR Ratings. In fact, the Data Scientist who helped me created the model has been trading a version of it since 2014. His data CLEARLY shows that staying invested with the best POWR Ratings stocks is a wise decision.
Back to the 200 day moving average. The merits of this technical signal is hard to admit for someone like myself with an economics background. But then I remembered some behavioral finance studies from that Mohamed El-Erian discussed a few years back.
The original theory was that investors predicted events 4-6 months in advance. That is why stocks typically dumped before bad economic events happened and seemed to rise during the darkest hour before the data improved.
Interestingly, some of the more recent research shows that it may not be that investors are so clairvoyant. Rather the positive or negative vibes from the stock price trends had a resounding effect on the economy.
At first this notion sounds crazy. But let’s remember that the vast majority of wealth in this country is in the hands of the top 10% who own 90% of the assets. No doubt a lot of that money is in the stock market.
Now consider that these same folks are the captains of industry. So, when their portfolios take a hit...they see their net worth go down...which leads to more cautious personal and business spending...which slows the economy. Here we can clearly see how price action actually precedes economic activity.
On the flip side we have a soaring stock market in the midst of a weak economic outlook. The net worth of these same wealthy people are on the rise...which lifts their mood. As they become less cautious and more optimistic, they start to spend more...thus improving economic conditions...thus showing the wisdom of the rising stock prices.
Long story short, price action is another valuable leading economic indicator. This only increases the value of using the 200 day moving average as a key lever in when to be cautious (under 200 day) or more aggressive with stocks (over 200 day).
Sooo...should we keep moving up to 100% long stocks?
The short answer is yes...we should step by step keep moving in that direction from the 80% allocated portfolio. But because we have an array of higher beta picks, then we can easily outperform the S&P 500 even with 20% cash on the sidelines just like we did so far this week.
The longer answer is that the bear is in a deep coma...but not dead. And that’s because inflation is still well above the Feds 2% target which is why many market watchers are still concerned that the Fed may keep on their current hawkish path til employment breaks. That being the best bet to not have inflation reignite.
The risk is that once that you let the job loss genie out of the bottle...it is very hard to control. History shows that if the unemployment rate rises by 0.4% that it will typically go up at least another 1%. Talk about a narrow runway to make the soft landing.
Adding it altogether, the positive price action, improving inflation picture and continued lack of a recession forming makes it wise to keep moving more and more towards 100% invested in stocks...especially Risk On stocks which is the best place for outperformance in the early innings of a new bull market.
HOWEVER, we need to continue to sleep with one eye open for the potential return of recessionary fears and downward pressure on stock prices.
The employment picture and 200 day average gives us the best clues when we may need to get more defensive. Until we see cracks in that armor, then we will continue to have a bullish portfolio posture. And so far, so good on that front as we see a lot of budding green shoots in our portfolio of late.
What To Do Next?
Discover my current portfolio of 5 stocks and 4 ETFs that were handpicked to outpace the market in the weeks and months ahead.
This is all based on my 43 years of investing experience seeing bull markets...bear markets...and everything between.
If you are curious to learn more, and want to see these hand selected trades, then please click the link below to get started now.
Steve Reitmeister’s Trading Plan & Top Picks >
Wishing you a world of investment success!

Steve Reitmeister…but everyone calls me Reity (pronounced “Righty”)
CEO, StockNews.com and Editor, Reitmeister Total Return
SPY shares fell $0.44 (-0.10%) in after-hours trading Tuesday. Year-to-date, SPY has gained 19.66%, versus a % rise in the benchmark S&P 500 index during the same period.
About the Author: Steve Reitmeister

Steve is better known to the StockNews audience as “Reity”. Not only is he the CEO of the firm, but he also shares his 40 years of investment experience in the Reitmeister Total Return portfolio. Learn more about Reity’s background, along with links to his most recent articles and stock picks.
The post 2023 Investing Lessons Learned: Mid-Year Edition appeared first on StockNews.com