


Once a popular meme stock candidate, Mullen Automotive, Inc. (MULN) is witnessing a downward spiral, with shares falling close to 100% over the past year. The past month alone has seen a 63.3% drop in share price, with the stock hovering near its 52-week low of $0.10 recorded on July 5, 2023.
While MULN continues to establish partnerships and initiate product launches in an effort to highlight its growth potential within the electric vehicle (EV) industry and spur investors’ optimism, the stock looks poised for further depreciation.
Consistently trading under the $1 threshold, efforts have been deployed to elevate MULN’s stock price beyond Nasdaq’s bid requirement. To effect this, the company proposed a 1-for-100 reverse stock split in its SEC filing, following a previous 1-for-25 reverse stock split carried out in May.
There are clear signs that the financial standing of Mullen Automotive is presently compromised. Given such severe uncertainties, it may be wise for investors to exercise prudence and avoid engaging with this stock for now.
Let us explore a few key metrics affirming this cautionary standpoint.
MULN’s Financial Instability: Analyzing Significant Fluctuations and Downward Trends from 2020-2023
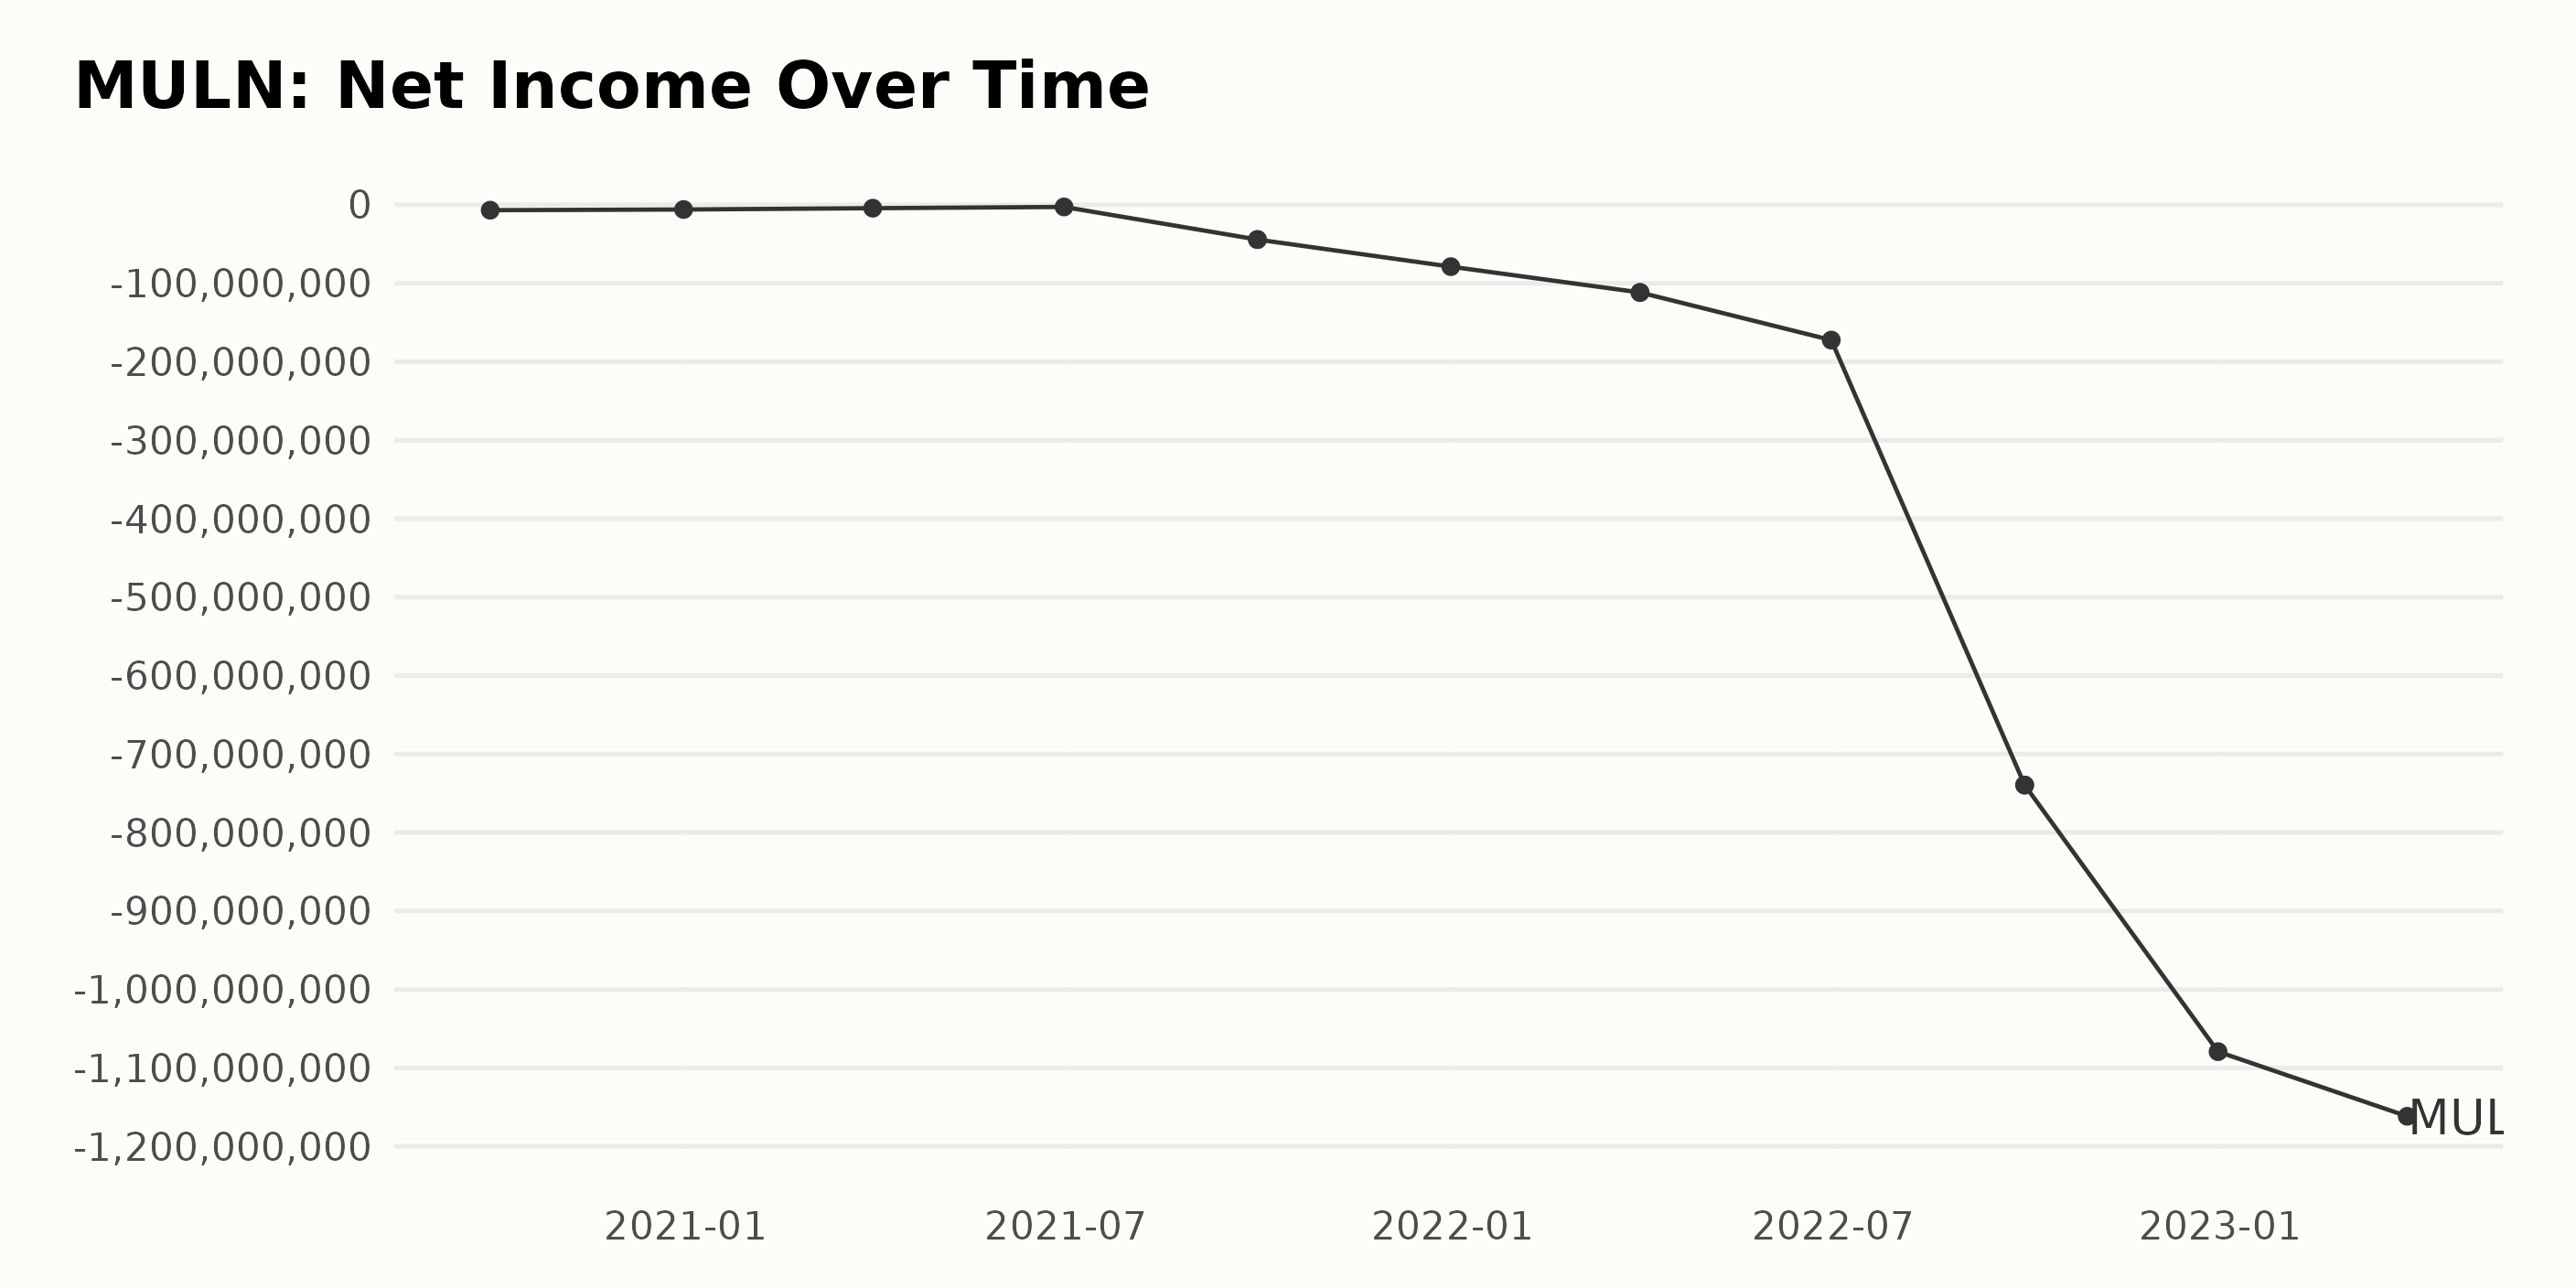
The trailing-12-month net income of MULN has experienced significant fluctuation and an overall downward trend in the past few years:
- As of September 30, 2020, the net income was at -$6.81 million.
- It showed a slight improvement by the end of the year, December 31, 2020, with a value of -$5.94 million.
- In the first quarter of 2021 (March 31), it stood at -$4.27 million; however, an increase was observed by the end of the second quarter (June 30) to -$2.68 million.
- This upward trend was abruptly interrupted by a sharp drop to -$44.24 million at the end of the third quarter (September 30) in 2021.
- The decline continued drastically in 2022, with the net income standing at -$78.78 million, -$111.66 million, -$172.40 million, and -$739.53 million at the end of each respective quarter.
- The net income further plummeted to -$1.07 billion on December 31, 2022, and -$1.16 billion by the end of the first quarter (March 31).
Considering the start value in September 2020 and the last available value in March 2023, there’s an alarming negative growth rate. This reveals that MULN has been increasingly operating at a loss over the considered timeframe.
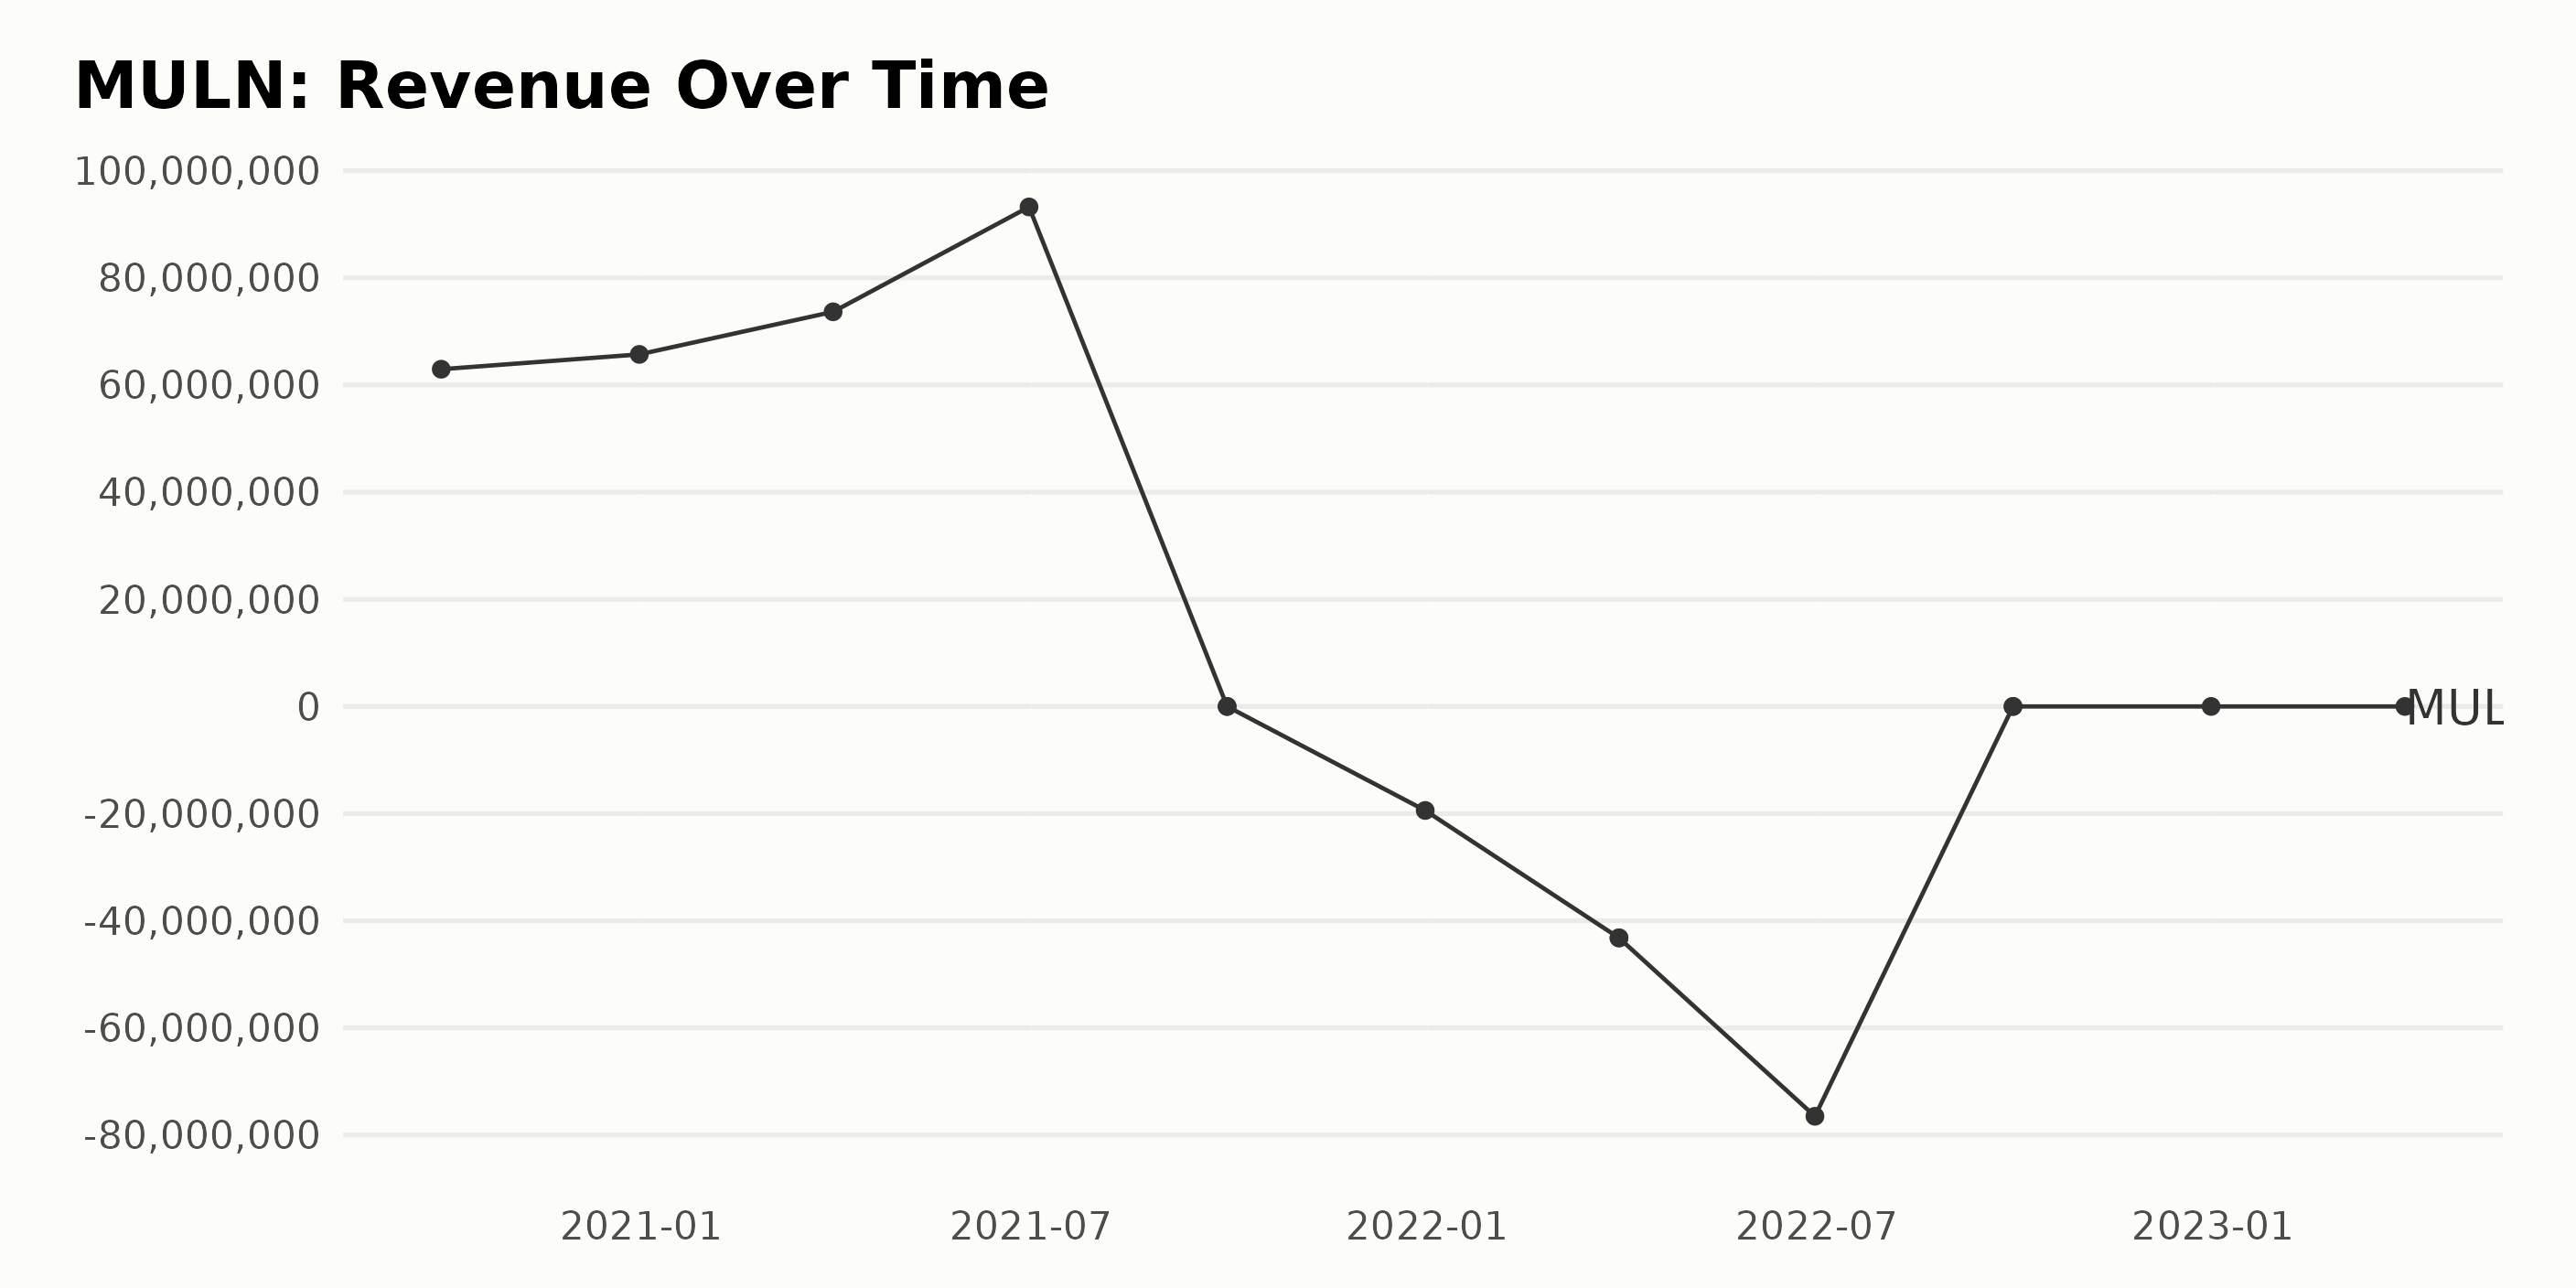
The trailing-12-month revenue trend and fluctuations of MULN indicate an unstable performance over time. This is based on the provided dataset from September 30, 2020, to March 31, 2023.
- Revenue gradually increased to $62.94 million (September 30, 2020), reaching $93.23 million by June 30, 2021.
- However, the company experienced a drastic fall in revenue to $0 in September 2021, repeating this value in two consecutive quarters until the end of the year.
- 2022 began with a significant downturn as negative revenue was reported, plunging to -$19.41 million in December 2021 and progressively falling further to -$76.49 million by June 2022.
- From September 2022 to the last recorded quarter in 2023 (March 31), the revenue remained static at $0.
Comparing the first reported value with the latest, MULN went from earning $62.94 million to making no revenue at all, representing a downward growth rate for the company. The fluctuations reflect high instability in revenue generation, with significant positive values turning into extreme negatives and then stabilizing at zero. This shift signals grave financial challenges for the company over the recent period.
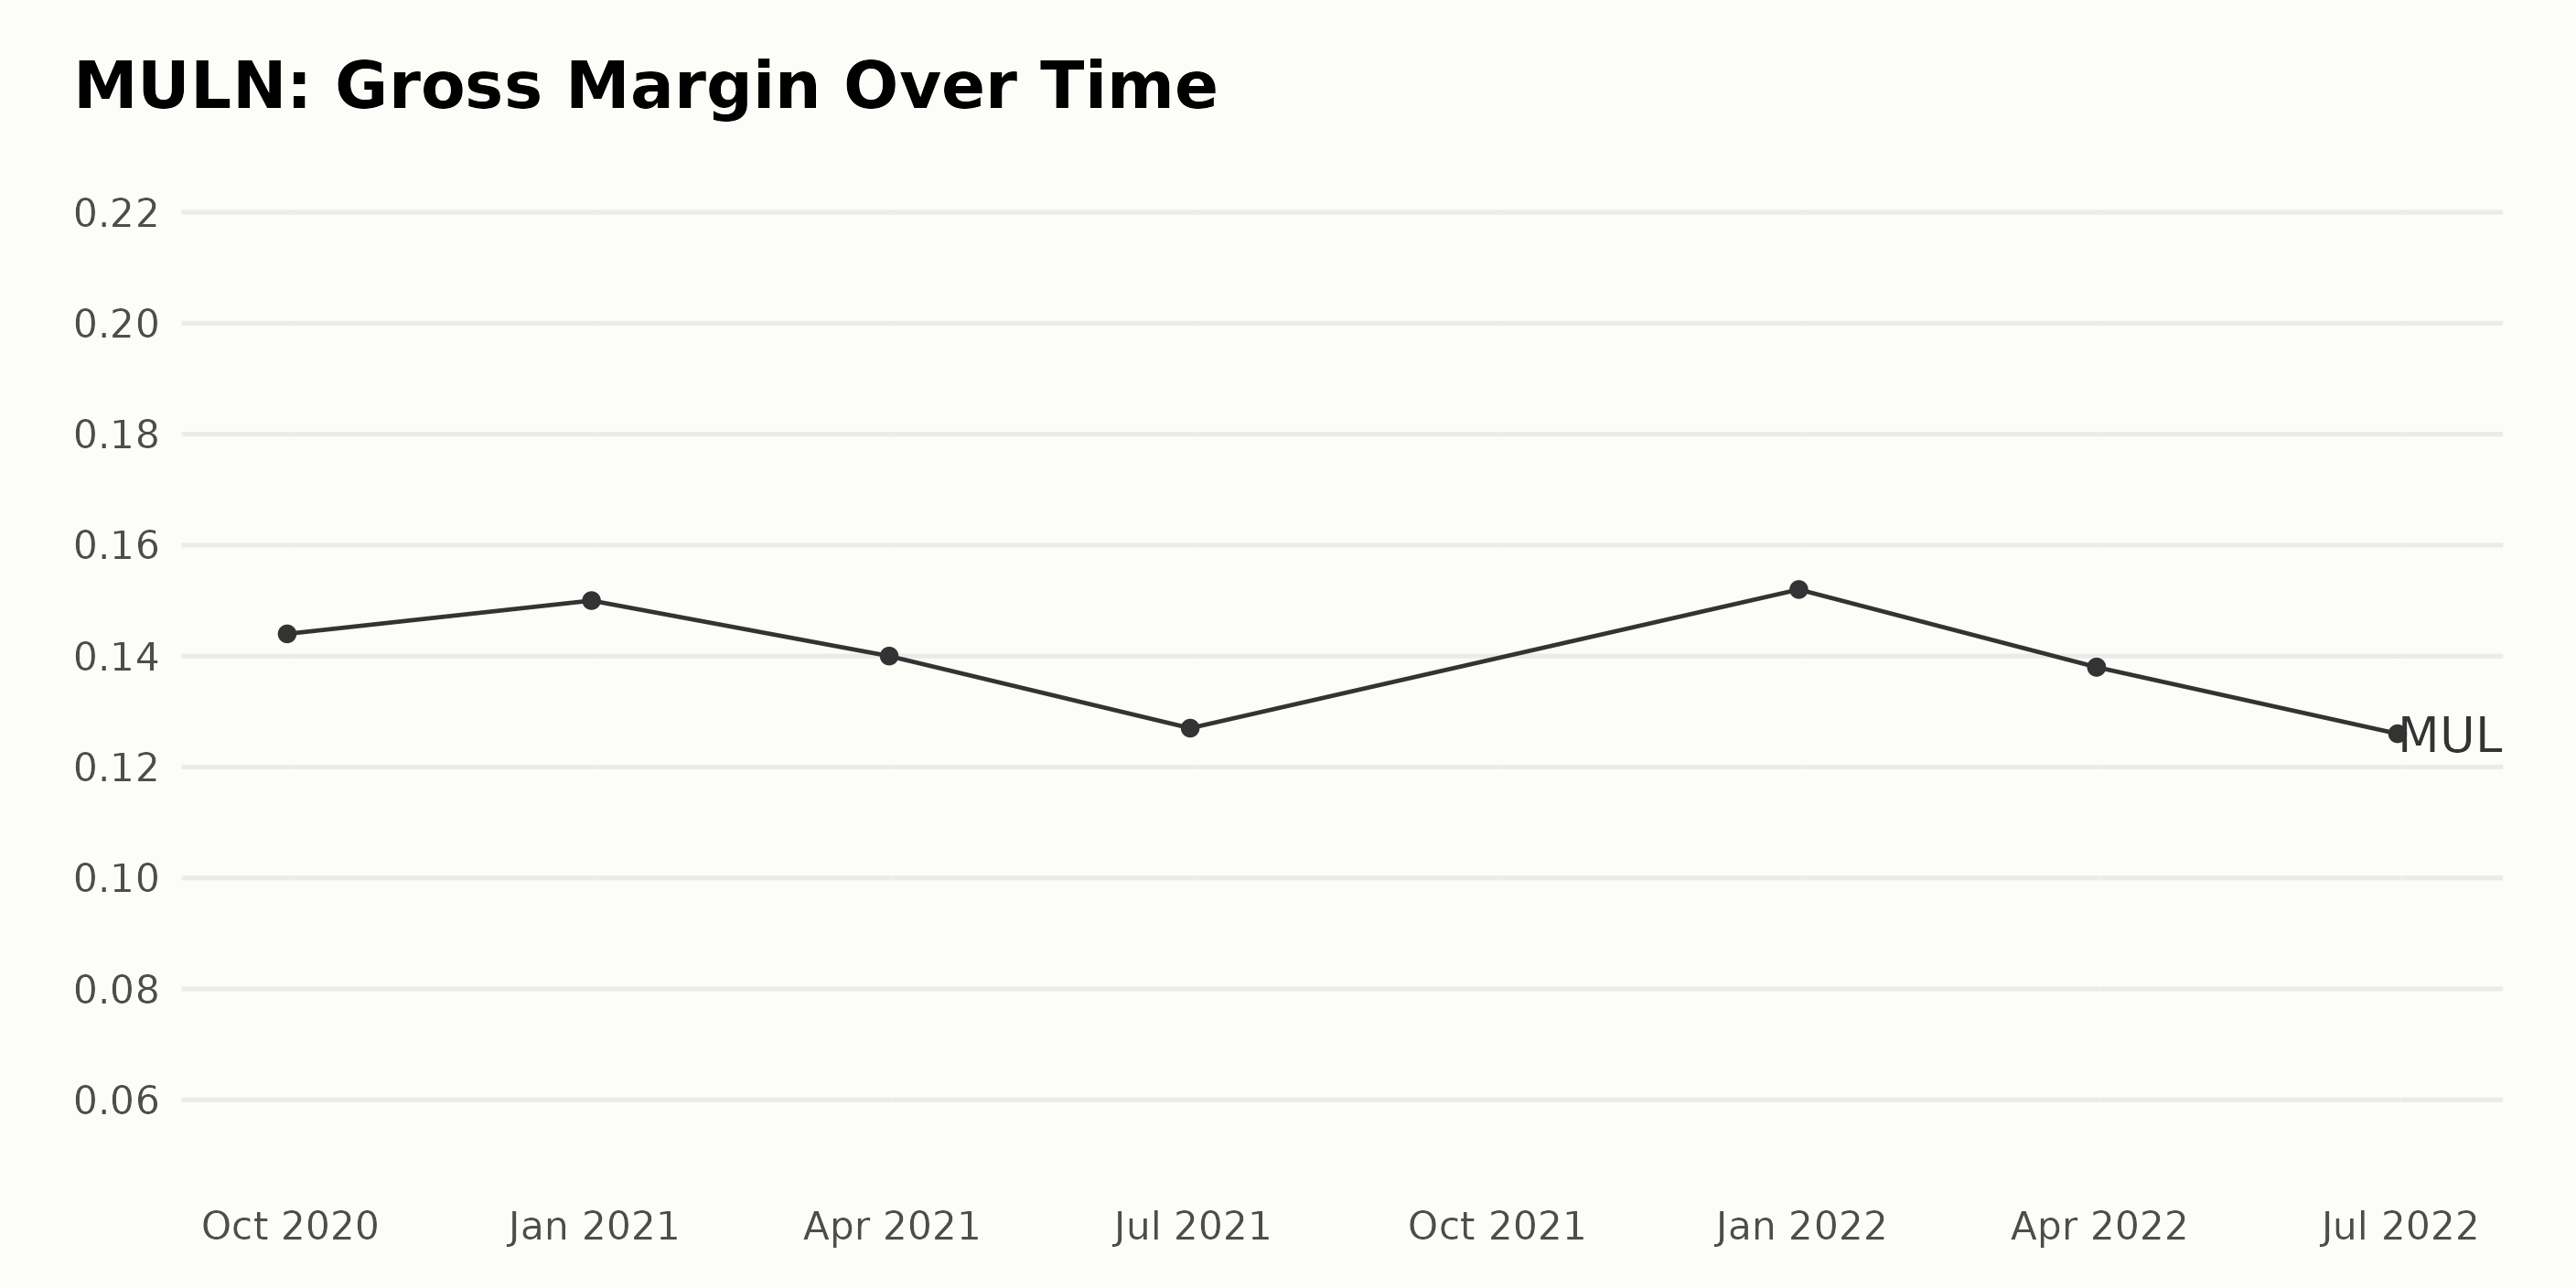
The Gross Margin of MULN presents a fluctuating trend over the period in review:
- September 2020: Gross Margin was 14.4%
- December 2020: It increased to 15.0%, showing the company’s profitability improvement.
- March 2021: A decline was then observed, with the value dropping to 14.0%, indicating a slight dip in profit relative to revenue.
- June 2021: This downward trend continued till mid-2021, with gross margin decreasing to 12.7%.
- December 2021: However, a revival occurred towards the end of that year, where the gross margin increased to 15.2%.
- March 2022: Although it dropped slightly to 13.8% by March 2022, the company maintained this rate till the end of March 2022.
- June 2022: As of the most recent report (June 2022), MULN’s gross margin was 12.6%, showing another slight decline from the previous months of 2022.
In terms of growth rate, there is an overall decrease of approximately 1.8 percentage points when comparing the first reported value (September 2020) with the last (June 2022), showing fluctuations but ultimately a slight downward trend.
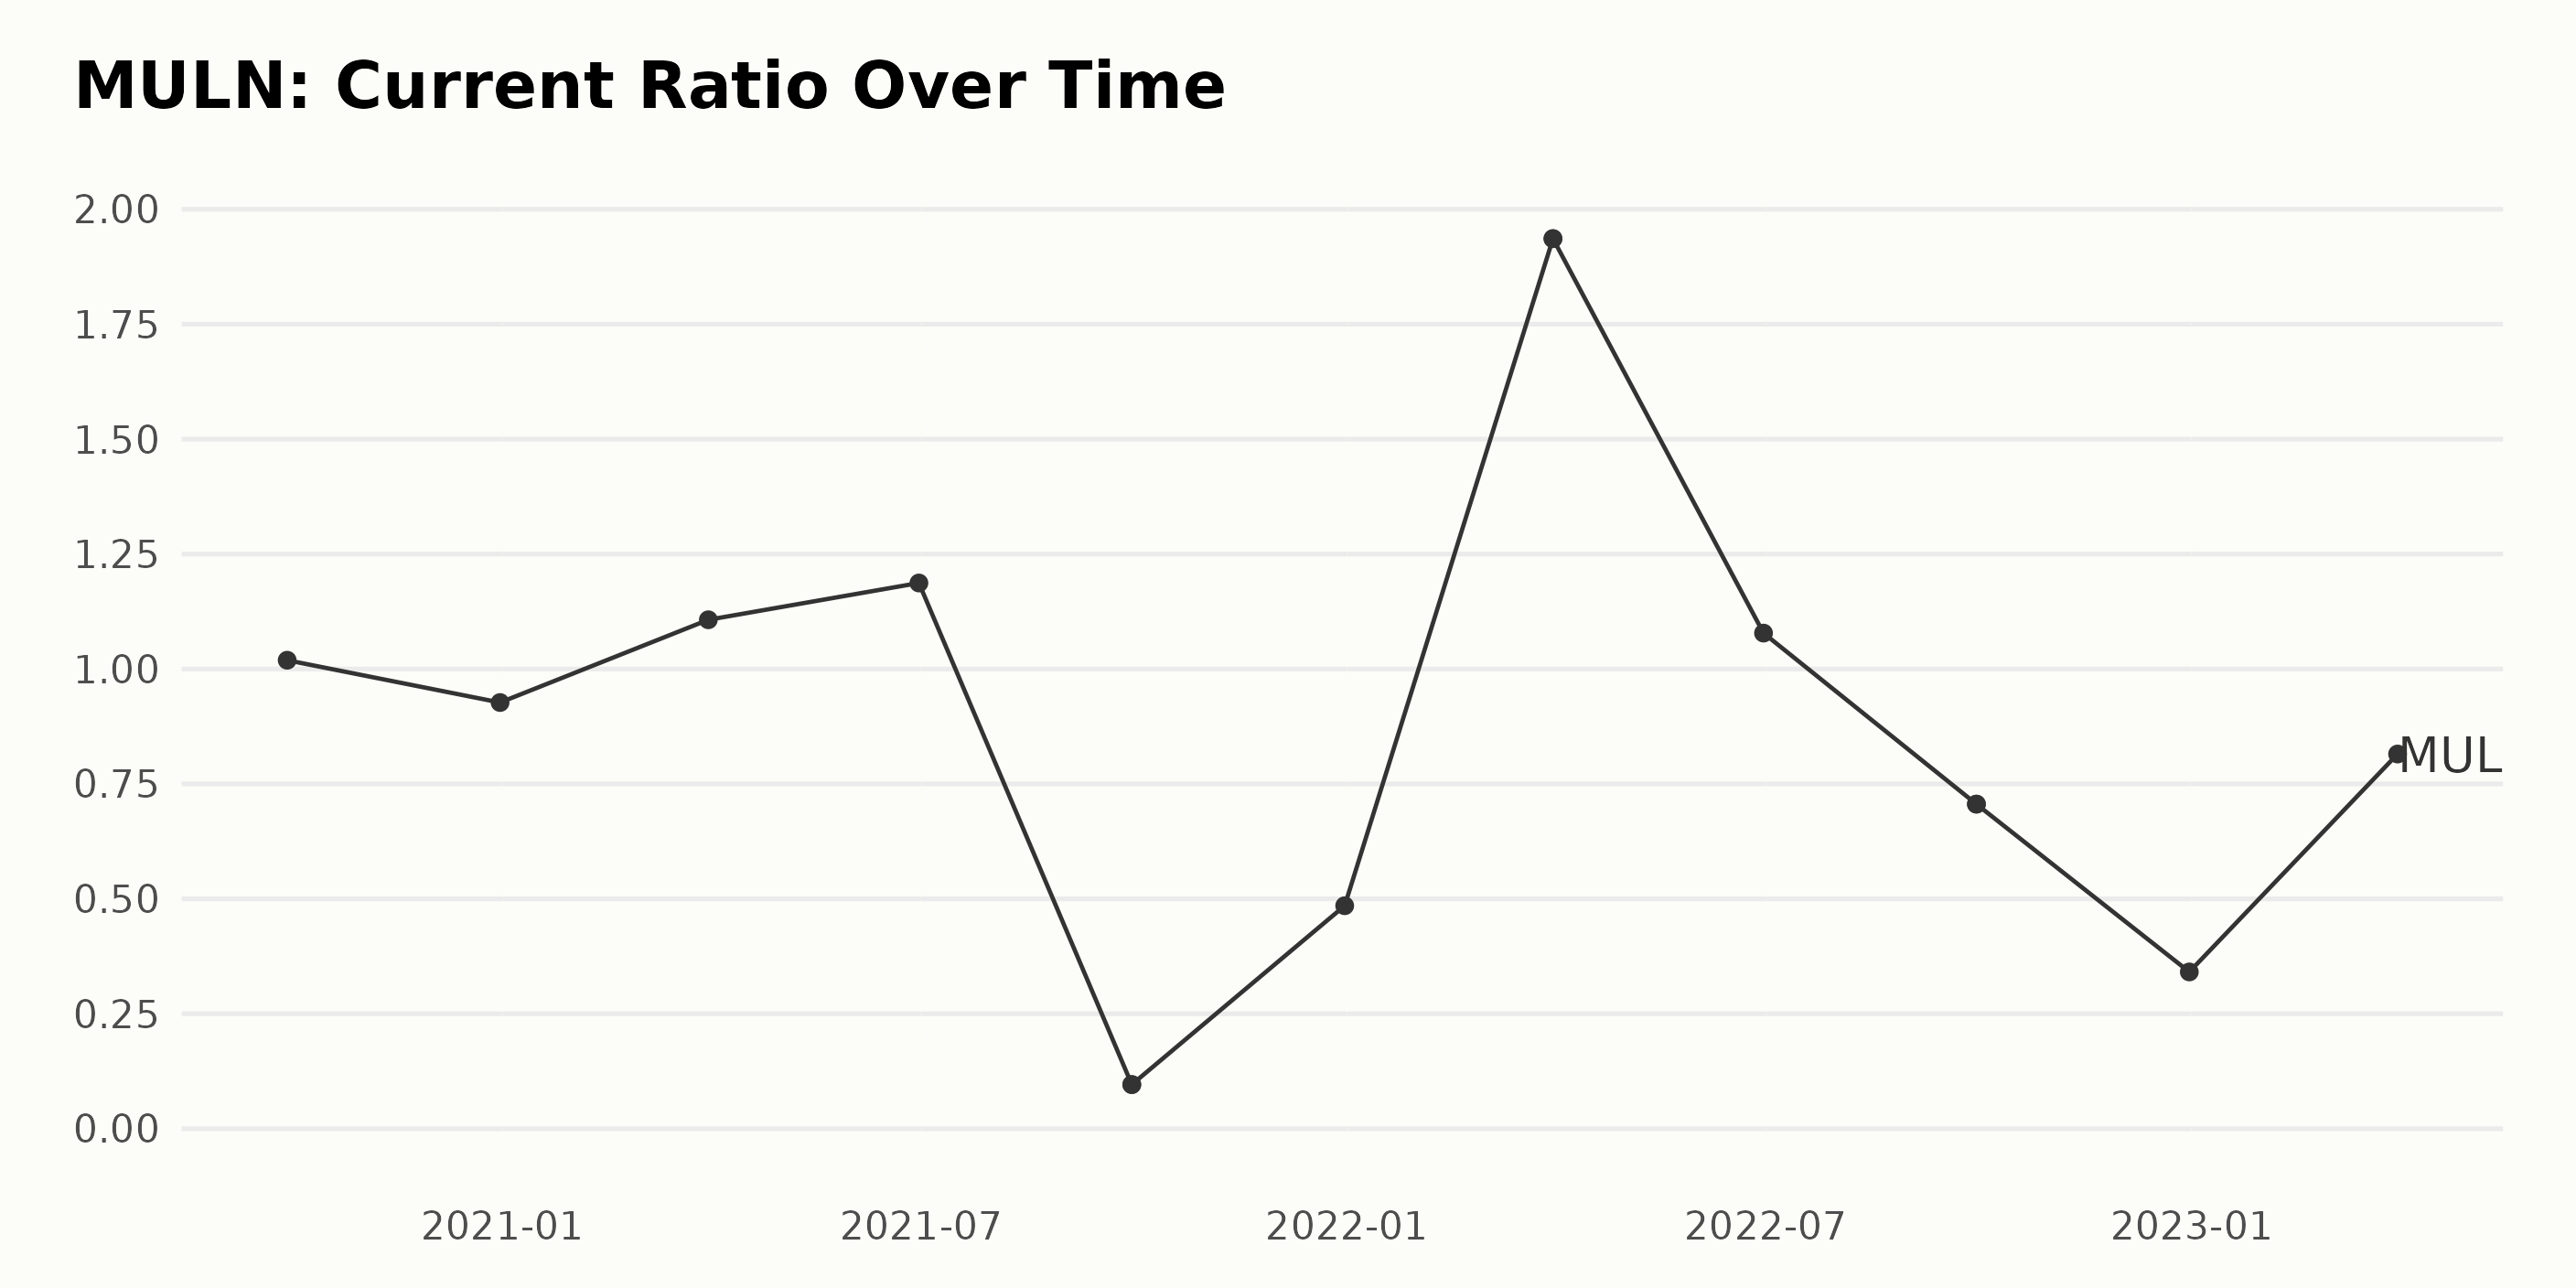
Based on the provided data, the current ratio of MULN has seen significant fluctuations over the analyzed period. Here is a summary of the trends and fluctuations:
- Starting in September 2020, the current ratio was at 1.02, which decreased to 0.93 by the end of December 2020.
- In the first quarter of 2021, there was an increase in the current ratio to 1.11, followed by a slight rise to 1.19 in June 2021.
- However, in September 2021, the current ratio dramatically dropped to 0.10 but slightly recovered to 0.49 by the end of the year.
- 2022 started with a strong increase in the current ratio to 1.94 in the first quarter, only to decline again to 1.08 by June and continue this downward trend through to September, where it sat at 0.71.
- The year ended with the current ratio falling further still to 0.34 in December 2022.
- As of the last recorded date, March 2023, the current ratio bounced back to 0.81.
When calculating the growth rate as the change from the first value to the last, it appears the current ratio has decreased by approximately 20%. This suggests that the company’s ability to cover its short-term liabilities with its short-term assets has worsened over the period.
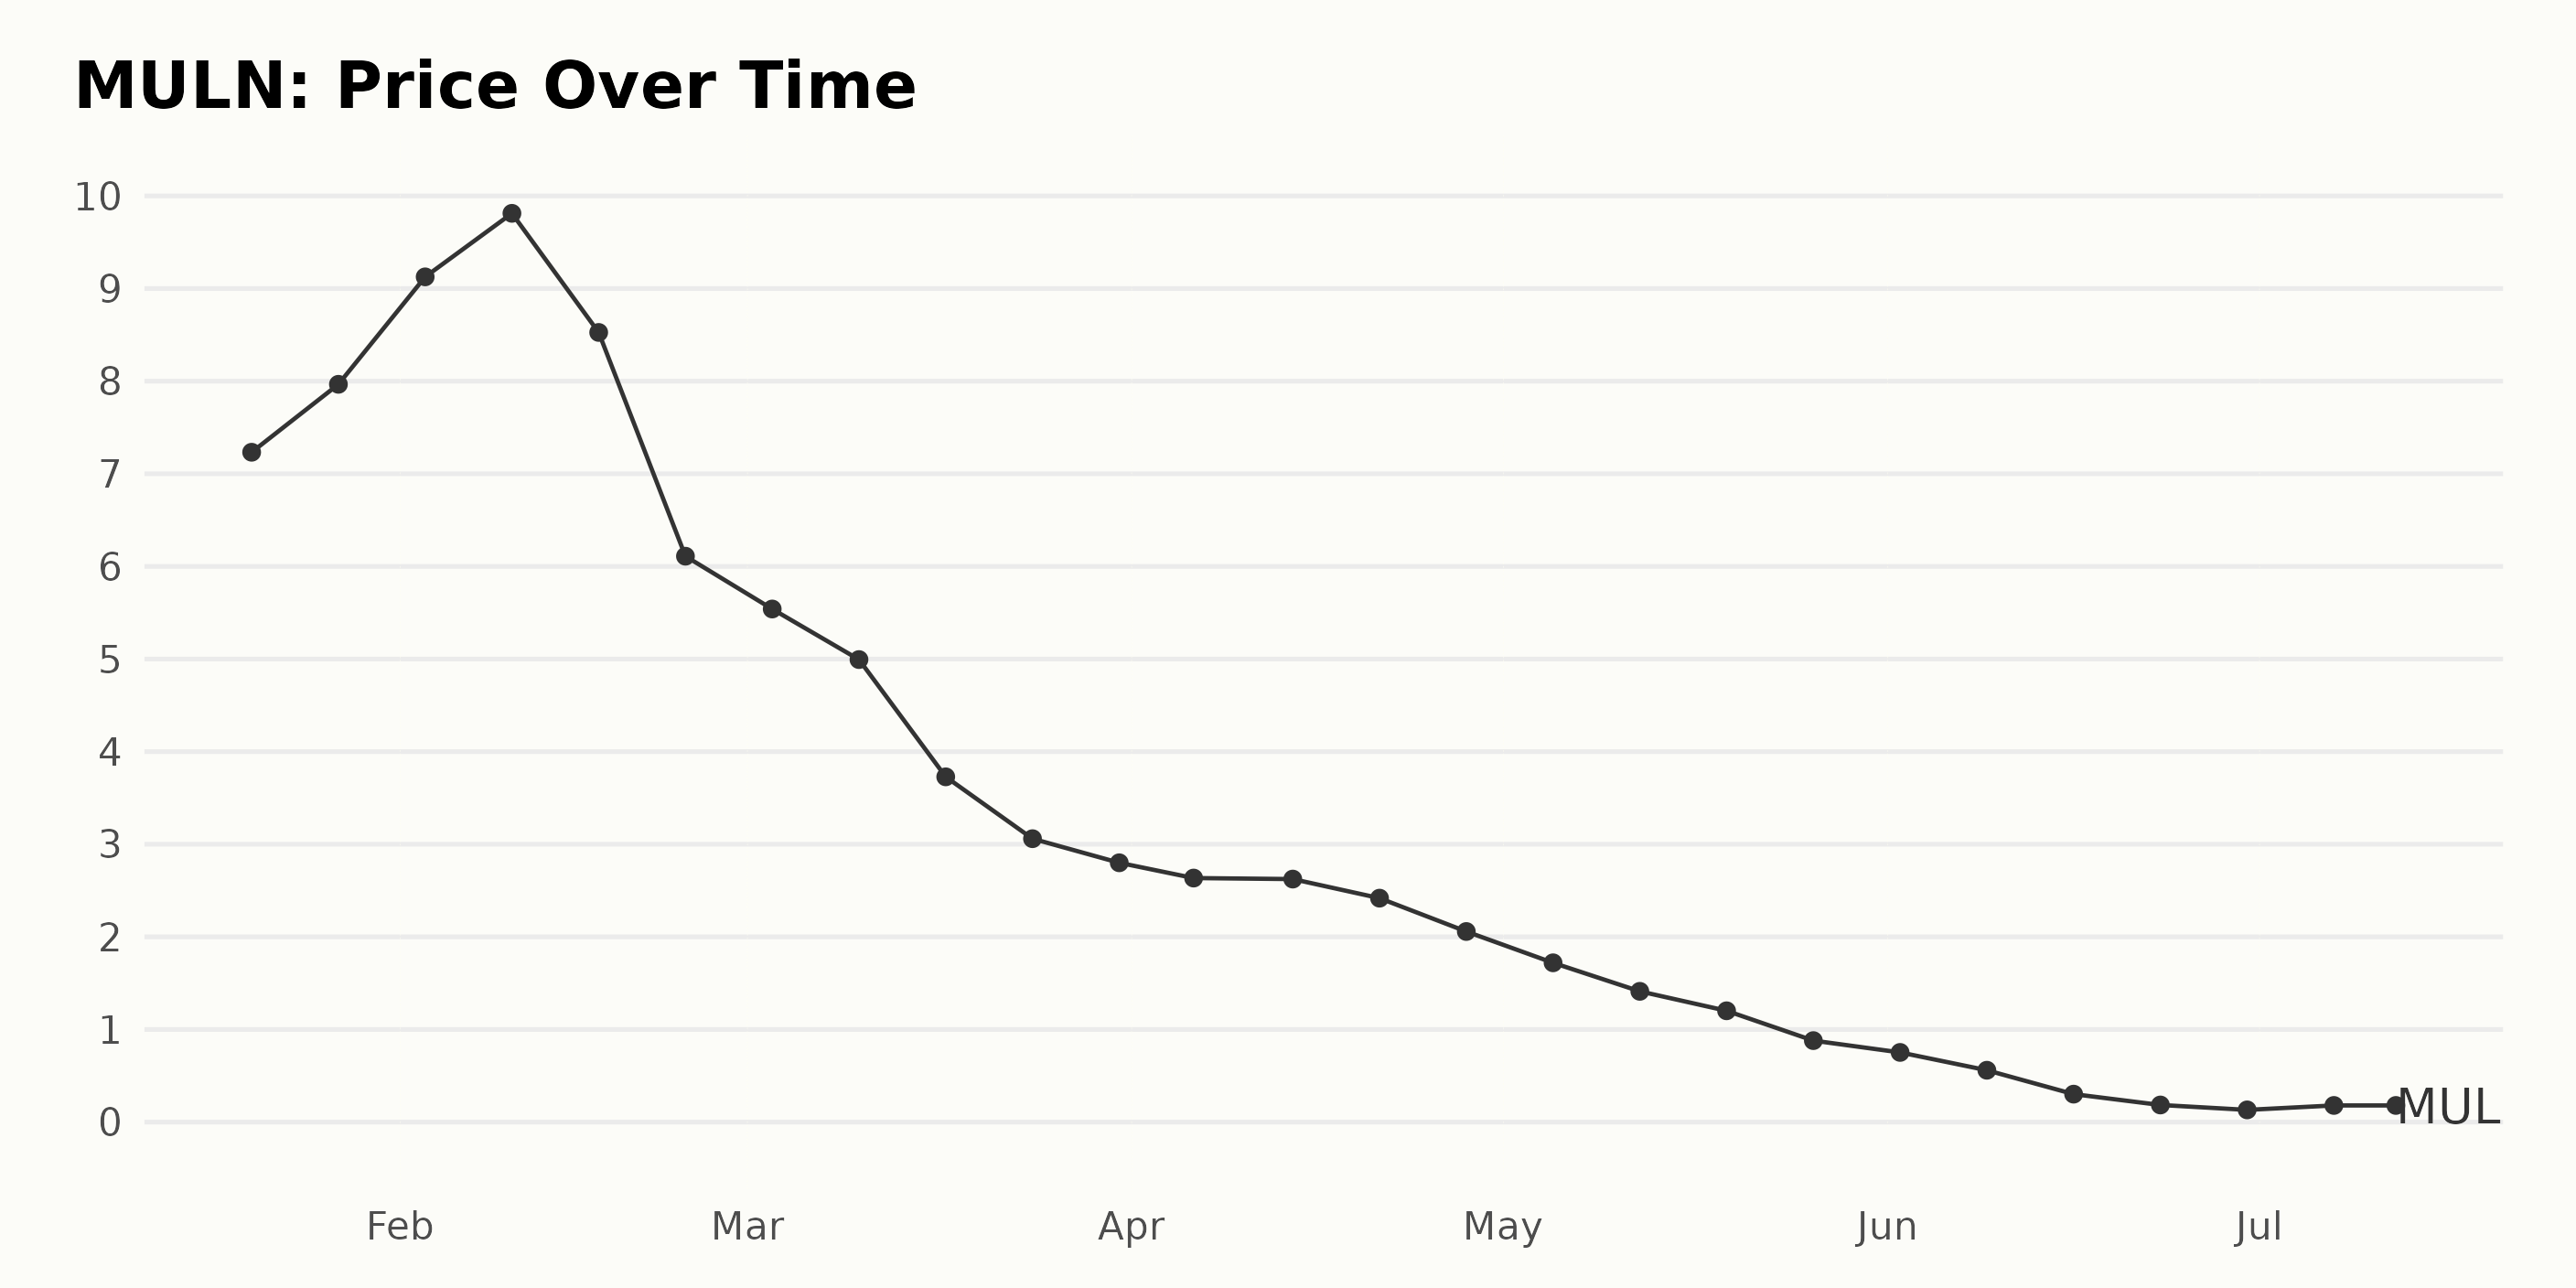
Tracking the Dramatic Rollercoaster: MULN’s Share Price in the First Half of 2023
Here’s the summary of MULN’s share price fluctuation throughout the first half of 2023:
- January 20, 2023: The share price started at $7.23.
- There was a steady increase over three weeks until February 10, 2023, with the price reaching its peak at $9.81, indicating an upward trend.
- However, from February 17 to March 31, there was a significant decline in value, plunging to $2.80, showing a dramatic downward trend.
- This downward trend continued slowly through April and into late May, finally bottoming out at $0.88 on May 26.
- The price continued to drop to a record low of $0.13 by June 30, 2023.
- Beginning July 2023, the price saw a minor rise, ending at $0.19 on July 7 and $0.14 on July 12, 2023.
In terms of growth rate, the data reveals a rapid increase initially, followed by a strong decelerating trend that starts in mid-February and continues until the end of June. Overall, the year's first half saw a sharp net decrease in MULN’s value. Here is a chart of MULN’s price over the past 180 days.
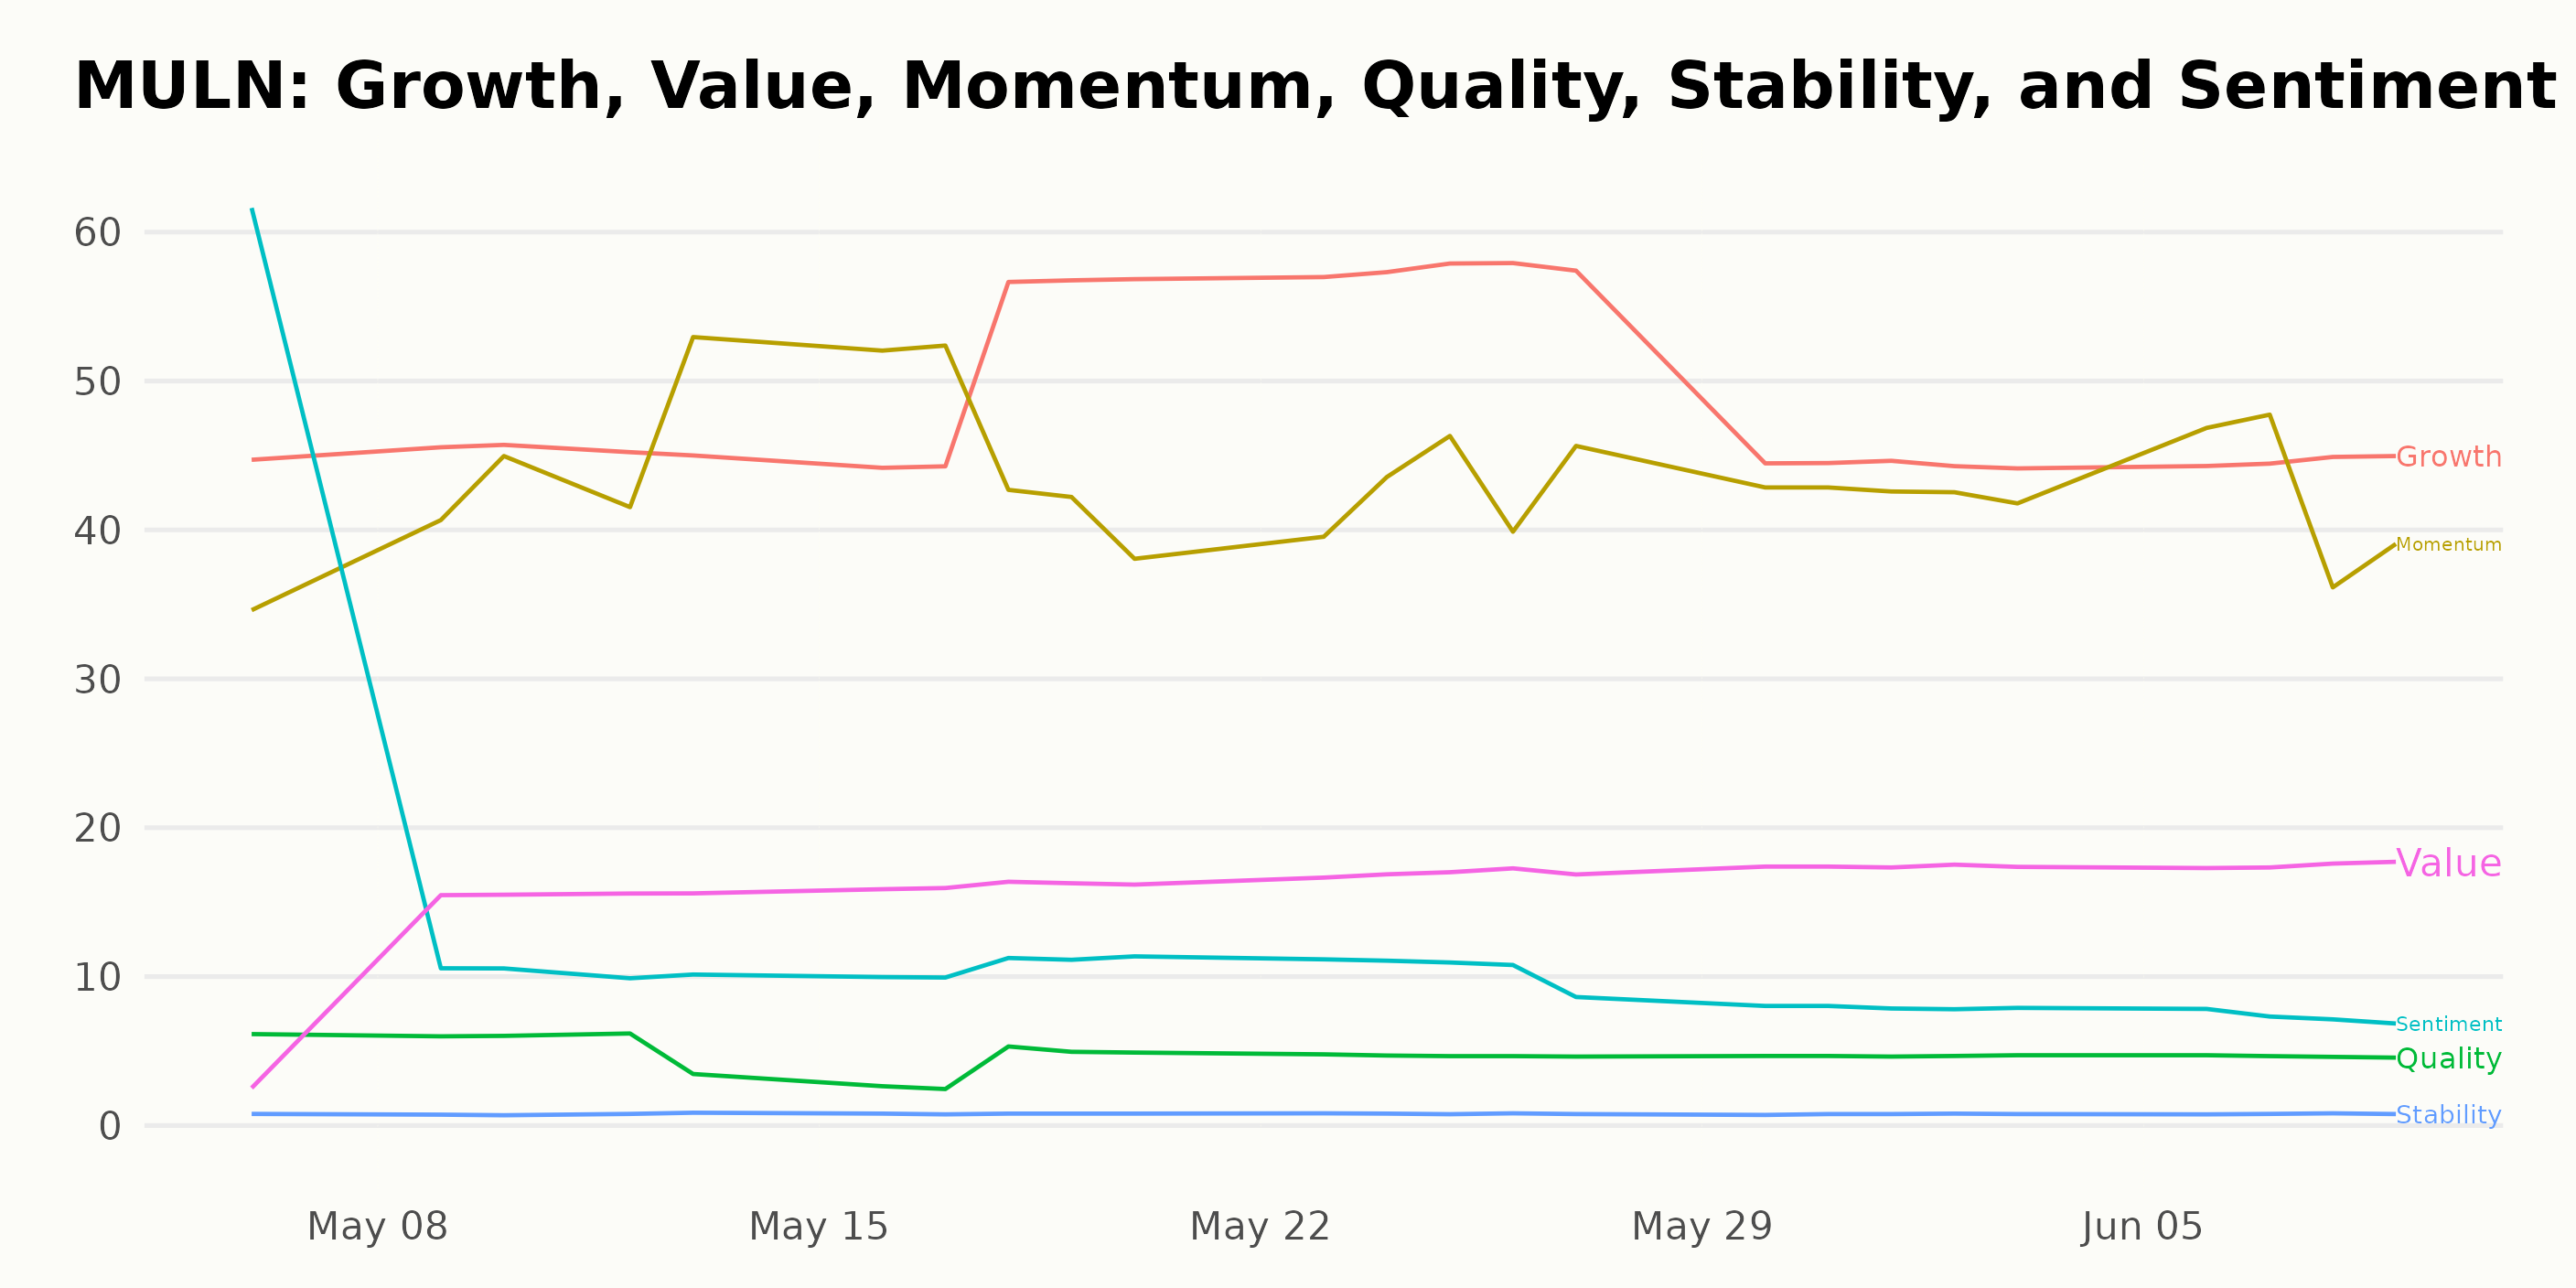
Analyzing MULN’s POWR Ratings: May-June 2023
MULN has an overall F rating, translating to a Strong Sell in our POWR Ratings system. It is ranked #52 out of 59 stocks in the Auto & Vehicle Manufacturers category. It also has an F grade in Stability and Quality and a D in Value and Sentiment.
Here’s a detailed weekly breakdown:
- Week of May 6, 2023: POWR Grade - F, Rank in Category - 47
- Week of May 13, 2023: POWR Grade - F, Rank in Category - 53
- Week of May 20, 2023: POWR Grade - F, Rank in Category - 51
- Week of May 27, 2023: POWR Grade - F, Rank in Category - 48
- Week of June 3, 2023: POWR Grade - F, Rank in Category - 52
- Week of June 9, 2023: POWR Grade - F, Rank in Category - 52
Remember that in the context of this data, a lower rank in category value is better, indicating a superior rank among the total 58 stocks in its category. By contrast, MULN’s rank hovers in the high 40s and low 50s, suggesting a less favorable position. As of the latest report on June 9, 2023, MULN holds the same F POWR grade and has a rank in the category of 52.
Stocks to Consider Instead of Mullen Automotive, Inc. (MULN)
Other stocks in the Auto & Vehicle Manufacturers sector that may be worth considering are Mercedes-Benz Group AG (MBGAF), Suzuki Motor Corp. (SZKMY), and Honda Motor Co. Ltd. (HMC) -- they have better POWR Ratings.
What To Do Next?
Discover 10 widely held stocks that our proprietary model shows have tremendous downside potential. Please make sure none of these “death trap” stocks are lurking in your portfolio:
MULN shares were trading at $0.15 per share on Thursday afternoon, down $0.00 (+2.90%). Year-to-date, MULN has declined -97.90%, versus a 18.21% rise in the benchmark S&P 500 index during the same period.
About the Author: Subhasree Kar

Subhasree’s keen interest in financial instruments led her to pursue a career as an investment analyst. After earning a Master’s degree in Economics, she gained knowledge of equity research and portfolio management at Finlatics.
The post Mullen Automotive Inc. (MULN): Is This Auto Stock a Good Buy? appeared first on StockNews.com