


It is easy to get a case of “Information Overload” when it comes to investing.
So many economic reports. So much price action. So many pundits with opinions flowing in every different direction.
Yet as I look at our current situation, I think the bull/bear debate will be settled by 1 single factor. That being the health of the employment picture. Read on below for more insight and what it means for our trading plans.
Market Commentary
The faux stock rally post 6/14 Fed meeting has already faltered. That was not so obvious at first as the S&P 500 (SPY) broke above 4,400. Yet under the surface, once again, it was a hollow victory.
Meaning that just like the majority of 2023 the gains only accrued to the usual suspects in the mega cap and tech space while at the same time mid caps and small caps were painted red. That pain broadened out this week and even the large caps took it on the chin.
Likely a main cause was Powell being a bit more sternly hawkish as he testified to the House Financial Services Committee on Wednesday. In my book he stuck to the usual talking points of a lot more work to be done and probably 2 more hikes along with a weakening of the employment picture before their work of taming inflation is done.
Those were the same points as back on 6/14. Yet this time his tone better matched the seriousness of his words.
Meaning that back on 6/14 I thought Powell’s was a bit too soft and thus did not match the stiff restrictions they are prepared to do. This is likely why some bulls hit the buy button not appreciating how likely the Fed’s actions are to cause a recession in the months ahead. A week later on 6/21 more investors got the memo on how it is not so bullish for the economy or stock market.
At this stage investors are getting tired of words. They want proof positive of where things stand to dictate their next moves.
This has us all on recession watch. That starts with a focus on the key economic indicators in manufacturing, services, retail sales etc.
However, let’s remember that Q1 of 2022 actually saw negative GDP and yet was not a recession because employment stayed strong. So, at this stage we need to have a focus on the jobs market as an indicator as to whether a recession is finally afoot.
The market will mostly move based upon the release of the Government Employment Situation report which is the first Friday of every month (7/7). Gladly we don’t have to wait that long for leading indicators that could tell us if things are getting worse.
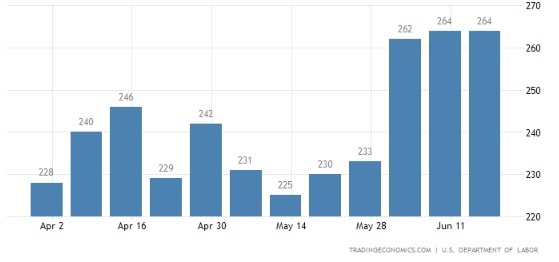
That investigation starts every Thursday with the release of the Jobless Claims report which has recently jumped 15% to 264K per week. Note that at 300K+ weekly claims generally points to a period in which the unemployment rate will start to rise.
Other places with clues are the Employment components of ISM Manufacturing (7/3) and ISM Services (7/6). The most recent readings in June came in at 51.4 and 49.2 respectively (below 50 = contraction).
Both of these readings are anemic with the much larger services sector seeing a precipitous drop from 54 just a few months back. These readings tell you about the diminishing intention of employers to hire in the future.
Similar to this is the keeping tabs on the NFIB Small Business Optimism Index (7/12). The worse these business leaders feel about the outlook for the economy...the less likely they will be to hire additional employees. The last 2 months have provided the lowest readings in a year. That bodes poorly for future hiring plans.
Lastly is the JOLTs Job Openings (7/6) which measures the # of openings that are publicly posted. Consider that before companies start letting go of employees, they first will stop hiring new ones.
This indicator has been at record levels in the past year with over 11 million job openings. That has recently dropped a little more than 10% from recent peaks, but still very high showing robust job demand. Signs of further weakness here could be telling of future declines in the unemployment rate.
Trading Plan
My prediction of stocks pausing at 4,400 with a 3-5% correction unfolding seems well timed. Consider this a new trading range and holding pattern until investors assemble facts on whether a recession is coming or if the Fed amazingly manufactures a soft landing.
Everyone knows their track record is not great. 12 of the last 15 rate hike cycles have ended in recession. Almost every time they predicted a soft landing and yet failed 75% of the time.
Now this go around they are actually predicting a mild recession. So that would seem to tip the scales in a recessionary direction. But when you consider the same level of overshoot...it probably going to be more severe than just a mild recession.
The key to the recession picture, as shared above, is employment. Let’s keep our eyes on these leading indicators to give us a leg up in predicting what happens next.
When you boil it down it works like this:
Rising unemployment = recession = bear market reawakens with stocks tumbling lower = get more defensive in your portfolio
Stable employment = soft landing = new long term bull market ascends to new heights = get more aggressive in your portfolio
Get those employment report dates on your calendar to keep tabs of this vital indicator. This will give you a running head start on the rest of investors who may only react to the monthly Government Employment Situation report.
What To Do Next?
Discover my balanced portfolio approach for uncertain times.
It is perfectly constructed to help you participate in the current market environment while adjusting more bullish or bearish as necessary in the days ahead.
If you are curious in learning more, and want to see the hand selected trades in my portfolio, then please click the link below to what 43 years of investing experience can do for you.
Steve Reitmeister’s Trading Plan & Top Picks >
Wishing you a world of investment success!

Steve Reitmeister…but everyone calls me Reity (pronounced “Righty”)
CEO, StockNews.com and Editor, Reitmeister Total Return
SPY shares were trading at $433.21 per share on Friday afternoon, down $3.30 (-0.76%). Year-to-date, SPY has gained 14.13%, versus a % rise in the benchmark S&P 500 index during the same period.
About the Author: Steve Reitmeister

Steve is better known to the StockNews audience as “Reity”. Not only is he the CEO of the firm, but he also shares his 40 years of investment experience in the Reitmeister Total Return portfolio. Learn more about Reity’s background, along with links to his most recent articles and stock picks.
The post KISS Investing = Focus On... appeared first on StockNews.com