The Trend Asset Allocation Model is an asset allocation model that applies trend-following principles based on the inputs of global stock and commodity prices. This model has a shorter time horizon and tends to turn over about 4-6 times a year. The performance and full details of a model portfolio based on the out-of-sample signals of the Trend Model can be found here.

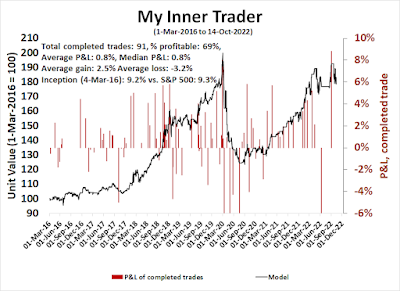
My inner trader uses a trading model, which is a blend of price momentum (is the Trend Model becoming more bullish, or bearish?) and overbought/oversold extremes (don't buy if the trend is overbought, and vice versa). Subscribers receive real-time alerts of model changes, and a hypothetical trading record of the email alerts is updated weekly here. The hypothetical trading record of the trading model of the real-time alerts that began in March 2016 is shown below.

The latest signals of each model are as follows:
- Ultimate market timing model: Sell equities*
- Trend Model signal: Neutral*
- Trading model: Bullish*
Update schedule: I generally update model readings on my site on weekends and tweet mid-week observations at @humblestudent. Subscribers receive real-time alerts of trading model changes, and a hypothetical trading record of those email alerts is shown here.
Subscribers can access the latest signal in real-time here.
A failed reversalLast week, I highlighted a possible bullish reversal candlestick on the weekly chart, but warned that the reversal needs to be confirmed by the next candle. This week, the S&P 500 weakened and failed to confirm the reversal candle, though the market is still exhibiting a positive 5-week RSI divergence and it is still testing support at the 200 week moving average.

Regardless, I am seeing helpful signs of leadership rotation. During bear markets, the old market leaders fade and new leadership emerges to lead the new bull cycle. The change in leadership is a constructive market internal that is indicative of a bottoming process.
The full post can be found here.


