"Well I don't know why I came here tonight. I've got the feeling that something ain't right. I'm so scared in case I fall off my chair, And I'm wondering how I'll get down the stairs. Clowns to the left of me! Jokers to the right! Her I am stuck in the middle with you." – Stealers Wheel Well, shorting certainly didn't work out yesterday as the S&P blasted back over 4,400 and is now testing the 200 dma at 4,496 and we'll see if that goes but WHY are we suddenly so bullish – that is baffling . Even this morning, Netflix (NFLX) is dropping over 25% but the Nasdaq seems unphased by the $50Bn loss in market cap. If the indexes are determined to simply ignore earnings and resume their daily uptrend – we should start seeing progress on the Retracement Bounce Chart – which tracks how far we've come off the highs – at the moment though, we're still pretty red: Dow 36,000 to 34,200 has bounce lines of 34,560 (weak) and 34,920 (strong) S&P 4,700 to 4,465 has bounce lines of 4,512 (weak) and 4,559 (strong) Nasdaq 16,500 to 15,675 has bounce lines of 15,840 (weak) and 16,005 (strong) Russell 2,400 to 2,080 has bounce lines of 2,144 (weak) and 2,208 (strong) IN PROGRESS
"Well I don't know why I came here tonight.
I've got the feeling that something ain't right.
I'm so scared in case I fall off my chair,
And I'm wondering how I'll get down the stairs.Clowns to the left of me!
Jokers to the right!
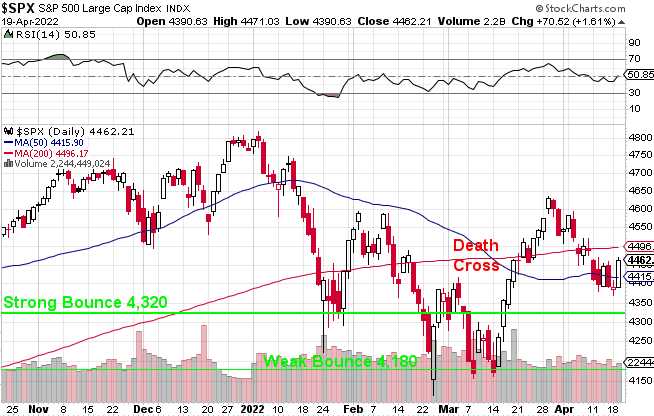
Her I am stuck in the middle with you." – Stealers WheelWell, shorting certainly didn't work out yesterday as the S&P blasted back over 4,400 and is now testing the 200 dma at 4,496 and we'll see if that goes but WHY are we suddenly so bullish – that is baffling.
Even this morning, Netflix (NFLX) is dropping over 25% but the Nasdaq seems unphased by the $50Bn loss in market cap. If the indexes are determined to simply ignore earnings and resume their daily uptrend – we should start seeing progress on the Retracement Bounce Chart – which tracks how far we've come off the highs – at the moment though, we're still pretty red:
Dow 36,000 to 34,200 has bounce lines of 34,560 (weak) and 34,920 (strong)
S&P 4,700 to 4,465 has bounce lines of 4,512 (weak) and 4,559 (strong)
Nasdaq 16,500 to 15,675 has bounce lines of 15,840 (weak) and 16,005 (strong)
Russell 2,400 to 2,080 has bounce lines of 2,144 (weak) and 2,208 (strong)
IN PROGRESS


