


 And just like that we're failing at the Bounce Lines.
4,512 is the weak bounce line on our bullish Bounce Chart (see yesterday's PSW Report for more details) and the S&P Futures (/ES) topped out at 4,514.75 before being rejected at the exact spot our Fabulous 5% Rule™ predicted way back in January. More to the point, for you TA fans – see that "W" that's formed since mid-February? If we can't break higher (4,500), then we're beginning to form a consolidation pattern that's likely to break LOWER, not higher.
 Keep in mind however that, in the BIG PICTURE, this is, so far, barely a pullback at all. The S&P 500 was at 2,000 in 2017 and, even if we assume it grew at double the normal rate and gained 15% a year and was positive every year since, that would be 2,300 in 2018, 2,645 in 2019, 3,041 in 2020, 3,498 last year and now 4,022. THAT would be after 5 years of SPECTACULAR growth.
At the beginning of 2017, our GDP was $18.9Tn and now it's $24Tn so that's up 27% in 5 years – very impressive but the S&P 500 is up over 100% – 4x more than the economy has grown and, as we know, $11Tn of that $5.1Tn in growth was Stimulus coupled by low rates from the Fed – not exactly giving us a genuine reading, is it?
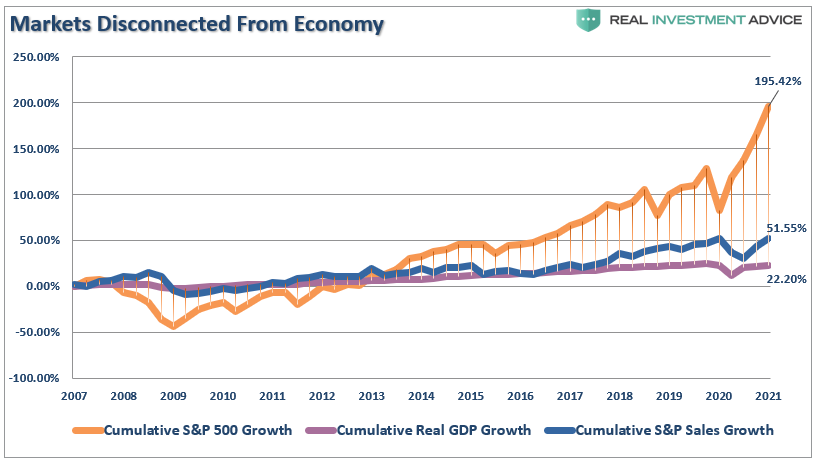 And the S&P isn't just disconnected from the Economy, it has become disconnected from its own sales numbers! As you can see from this chart – since 2007 (before the last collapse), the S&P is up over 200% (this chart only goes to 2021) in PRICE but it's up just 51.5% in Revenues. This does not make sense.
We have to ask ourselves, what is more likely to happen first? Are sales for the S&P going to double or are the prices we pay for stocks going to come down? At the moment, the bond market is crashing and housing is too expensive and commodities are out of control so the stock market still looks pretty attractive BUT,…
