


The most widely followed measure of implied volatility is the CBOE Volatility Index (VIX). It measures a 30-day implied volatility for the S&P 500 Index.
Many of you are likely familiar with the VIX from hearing it discussed on the major financial news networks. In fact, I talk about the VIX on a weekly basis on CBOE-TV “Vol 411”.
People look at the S&P 500 as a benchmark for how stock prices are generally doing. In a similar vein, option traders look at the VIX as a benchmark of how option prices are doing.
A higher VIX means more expensive options. A lower VIX means option prices are cheaper.
Implied volatility can be thought of the same way we think of insurance premiums:
- Safe and steady drivers have lower car insurance premiums. Safe, steady, and lower volatility stocks have lower option premiums.
- Crazy and reckless drivers have much higher premiums. Wilder, higher volatility stocks carry much higher option premiums.
So it’s no surprise that option prices are referred to as option premiums and that many portfolio managers will buy downside puts as insurance to protect their portfolios from lower prices.
There are six components that are used to price options:
- Stock Price
- Strike Price
- Expiration date
- Current Interest Rate
- Dividends (if any)
- Implied Volatility (IV)
The first five are known. You can look at your trading screen and see the stock price, strike price, days to expiration. Interest rates and dividends are easily found by doing a google search. The only unknown is implied volatility.
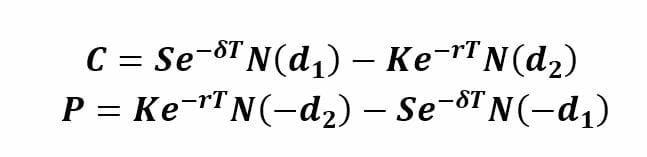
Simply put, implied volatility is the price of an option. No need to do the fancy math or the calculations shown below.
Implied volatility is called implied because it is the volatility input needed to match the price of the option to the price it is currently trading. A look at Apple (AAPL) options shows the implied volatility for the different strike prices.
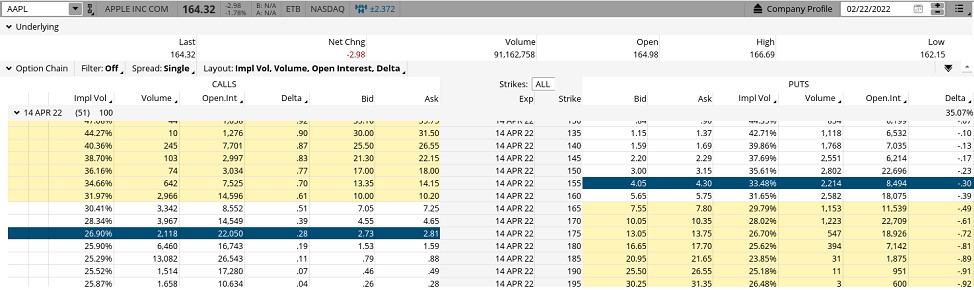
Note how different strikes of the same expiration date – April 14 in this instance- have different implied volatilities. This is called the skew.
An important takeaway is that out-of-the-money puts almost always trade at a higher level of implied volatility compared to similar out-of-the-money calls. The AAPL $155 puts are priced at a 33.48 IV, while the $175 calls are priced much lower at a 26.90 IV as shown in red.
The main reason for this difference is the fact that stocks tend to drop more quickly than they rise. So downside puts are more valuable than upside calls.
Implied volatility tends to be much higher in front of earnings and other corporate events. This makes sense since a potentially big move in the stock price is looming.
Implied volatility usually falls following the earnings release or company announcement as the unknown becomes known.
Having a better understanding that high implied volatility means higher option prices can be vital when considering potential trades. Paying a higher option price means you need a bigger move in the stock to justify the trade.
POWR Options always does an in-depth implied volatility analysis, along with using the POWR Ratings and technical analysis as part of the idea generation process. It is just as vital for individual traders to always consider levels of implied volatility when considering their trades as well.
Implied Volatility as a Market Timing Tool
Implied volatility can be used to identify potential turning points in the market. This is especially true when implied volatility spikes to extremes.
The charts below shows the VIX on the top and the S&P 500 on the bottom. Note how the previous spikes in VIX (highlighted in blue) ultimately signaled significant short-term bottoms in the S&P 500 (SPY).
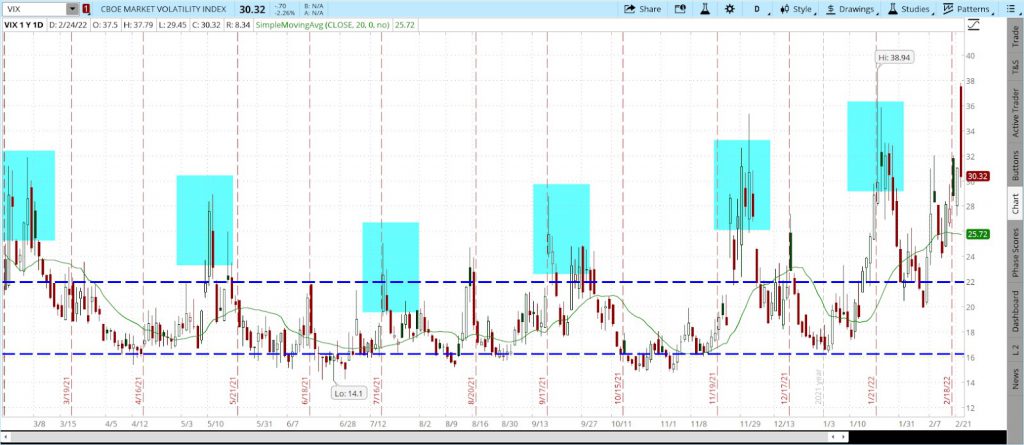
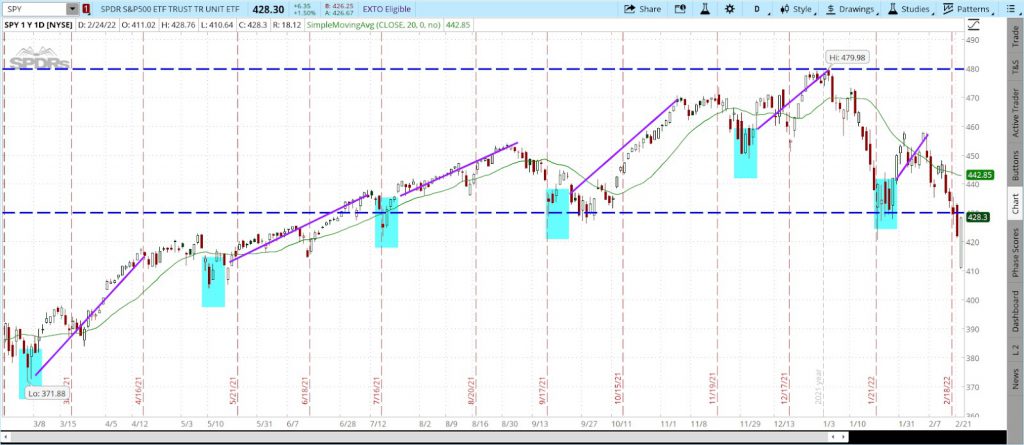
Long periods of low levels in the VIX are a sign of complacency, which usually are a reliable indicator of short-term market tops.
We will see if this week’s rally in the VIX is a buy signal as well. The old Warren Buffett adage, to be “fearful when others are greedy and greedy when others are fearful,” applies perfectly to this VIX market timing methodology.
Trading, as we know, is all about probability, not certainty. Understanding and using implied volatility to put those probabilities in your favor can be a valuable addition to your trading toolbox. In POWR Options it is one of the most important tools we use.
What To Do Next?
While the concepts behind options trading are simpler than most people realize, applying those concepts to consistently make winning options trades is no easy task.
The solution is to let me do the hard work for you, by starting a 30 day to my POWR Options newsletter.
I’ve been uncovering the best options trades for over 30 years and with the quantitative muscle of the POWR Ratings as my starting point, I’ve achieved an 82% win rate over my last 17 closed trades!
During your trial you’ll get full access to the current portfolio, weekly market commentary and every trade alert by text & email.
I’ll be adding the next 2 exciting options trades (1 call and 1 put) when the market opens this Monday morning, so start your trial today so you don’t miss out.
There’s no obligation beyond the 30 day trial, so there is absolutely no risk in getting started today.
About POWR Options & 30 Day Trial >>
Here’s to good trading!
Tim Biggam
Editor, POWR Options Newsletter
SPY shares were trading at $437.55 per share on Friday afternoon, up $9.25 (+2.16%). Year-to-date, SPY has declined -7.88%, versus a % rise in the benchmark S&P 500 index during the same period.
About the Author: Tim Biggam

Tim spent 13 years as Chief Options Strategist at Man Securities in Chicago, 4 years as Lead Options Strategist at ThinkorSwim and 3 years as a Market Maker for First Options in Chicago. He makes regular appearances on Bloomberg TV and is a weekly contributor to the TD Ameritrade Network "Morning Trade Live". His overriding passion is to make the complex world of options more understandable and therefore more useful to the everyday trader. Tim is the editor of the POWR Options newsletter. Learn more about Tim's background, along with links to his most recent articles.
The post Making Option Trading And Implied Volatility Easier To Understand appeared first on StockNews.com