


(Please enjoy this updated version of my weekly commentary from the Reitmeister Total Return newsletter).
Want to hear something new about the stock market?
That’s a shame...cuz I have nothing new to share with you ;-)
That’s because we have been in the same consolidation mode under 4,500 for over a month. And really going back to March the overall market hasn’t moved that much higher on a broad basis. Yet there has been volatility by the truckload.
Gladly there is money to be made if you look in the right places...like leaning on the POWR Ratings to point the way. This has allowed us to carve out gains while others have been served up frustration and disappointment. (including a modest gain this week while the S&P was in the red).
I will do my level best to share some fresh insights in the commentary below along with notes on our game plan and portfolio of stocks and ETFs.
Market Commentary
The most significant news of the past week was served up on Friday when the Government Employment Situation report showed that jobs added came up well short of expectations. Not only was the 194,000 jobs added the lowest result since December, but also woefully under the 475,000 jobs expected.
Now the reality check.
The Government report on employment is flat out wrong and ADP from last Wednesday showing 568,000 jobs added is right. Because, since when has the government ever done anything better than a for profit company? (he asks snidely)
More importantly, I have watched investors falsely react to the Government report for the last few decades all the while anyone who cares to pay attention would quite easily see that the ADP version does a much better job of reporting the trends. Even within the Government report are signs that they are calculating things wrong. That’s because there is no way you could have such modest job growth and still show a fairly large 0.3% monthly drop in the unemployment rate to 4.8%.
The point is the employment picture remains healthy. And the more people with jobs > more income > more spending > more profit growth > more impetus for stock prices to move higher.
The most interesting economic event on the week took place on Tuesday when the NFIB Small Business Optimism index fell to 99.1, the lowest level in 6 months. This seems odd with the economy is clearly improving on most every level.
The main reason these business owners are becoming less happy campers is that 50% of them noted difficulty in filling open positions. And typically it is taking pretty significant raises to get people to leave their current employers.
On top of that is the climate in DC where there are discussions of a fairly significant increase in the capital gains tax rate, which would take a nice bite out small business owner compensation. Put me down for wanting business taxes to be as low as humanly possible to encourage these risk takers to hire more and spend more money which is beneficial to the entire economy. And yes, to also keep these jobs in the US. (I will now put my soap box away).
Now let’s switch on over to a discussion of recent price action. As you will see in the S&P 500 chart below this is the first extended break under the 50 day moving average all year. And now the 100 day moving average (4,362) is under pressure as we ended Tuesday’s session just below.
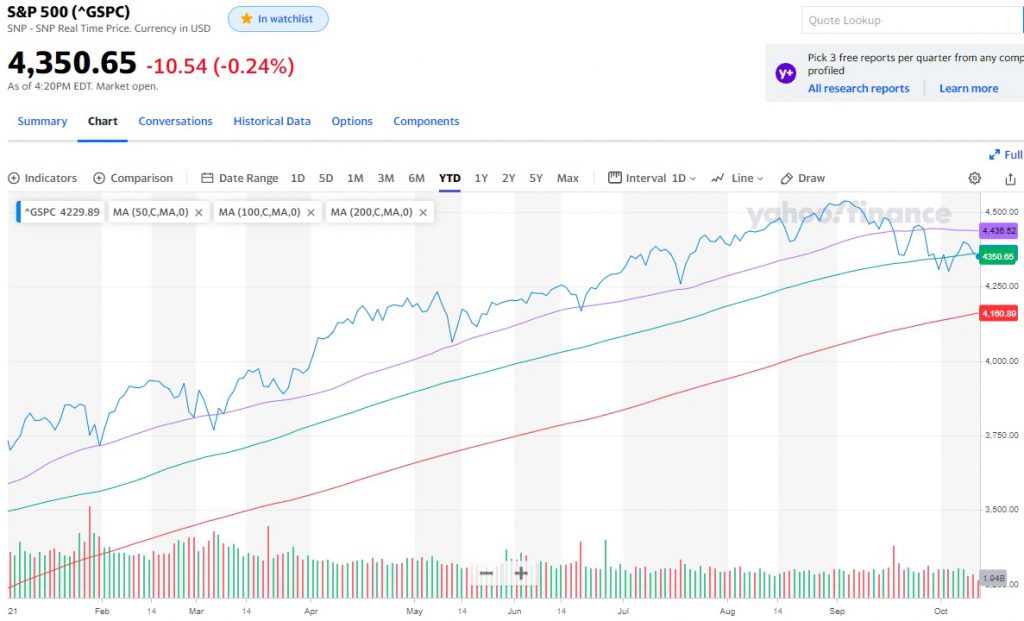
It appears to be that 4,300 is an area of strong support as most investors fully appreciate while market conditions are still quite bullish. So no reason to let things slip further. However, the longer this weak action goes on, the more I think the 200 day moving average (currently at 4,161) will be tested before this technical correction is over and then we can get back to the fundamental merits of the bull market.
That outcome is FAR from set in stone. And believe that even if it did happen, it would be so short lived and shallow that it’s not worth trading.
This is where we get back to market timing being the toughest game in town. And sometimes just better to stay concentrated on the primary long term trend.
That remains steadfastly bullish because of an improving economy combined with a low rate environment making stocks the best investment option around. My guess is the forthcoming earnings season will be a reminder to folks of these fundamental truths reawakening the bullish spirits for the next leg higher.
That is why our portfolio is fully loaded with healthy, growing companies trading at ample discounts to fair value. That is a strategy that has worked quite well so far in 2021...and should continue to do so coming down the home stretch of the year.
What To Do Next?
Start a 30 day trial to the Reitmeister Total Return portfolio.
Why?
Because it has beaten the market consistently over time. Here are the specifics as of 9/28/21:
Time Period | RTR Gains | S&P 500 Gains |
1 Month | +0.82% | -3.89% |
| 3 Months | +5.41% | +1.42% |
| Year to Date | +29.54% | +15.88% |
| 1 Year | +49.54% | +30.50% |
Where does the outperformance come from?
Because I have been a successful investor for over 40 years. And I have used that knowledge to hand select 12 Buy rated stocks and 2 ETFs ready to excel in the days and weeks ahead.
If you would like to see the current portfolio, and get my next trades, then start a 30 day trial by clicking the link below.
About Reitmeister Total Return newsletter & 30 Day Trial
Wishing you a world of investment success!

Steve Reitmeister
…but everyone calls me Reity (pronounced “Righty”)
CEO, Stock News Network and Editor, Reitmeister Total Return
SPY shares were trading at $433.14 per share on Wednesday morning, down $0.48 (-0.11%). Year-to-date, SPY has gained 16.98%, versus a % rise in the benchmark S&P 500 index during the same period.
About the Author: Steve Reitmeister

Steve is better known to the StockNews audience as “Reity”. Not only is he the CEO of the firm, but he also shares his 40 years of investment experience in the Reitmeister Total Return portfolio. Learn more about Reity’s background, along with links to his most recent articles and stock picks.
The post Why Are Stocks Stuck in the Mud? appeared first on StockNews.com