


(Please enjoy this updated version of my weekly commentary from the Reitmeister Total Return newsletter).
Investors are finally getting the message that the Fed is becoming more hawkish. Last Wednesday’s Fed announcement was incredibly clear on that front leading rates to finally head higher. This led to yet another “Ticker Tantrum” sell off on Tuesday.
Let’s once again review the facts of the situation and why this is a premature and foolish move. Meaning this is another “buy the dip” situation with the bull market having plenty of room to run higher.
Market Commentary
The financial media was proudly waving a bullish banner the past several sessions as stocks bounced back with gusto. Oh, but what a different tune they sang Tuesday as the market tumbled 2%.
U.S Stocks Slide as Bond Yield Hit Three Month High (WSJ.com)
Stocks Could Slide Further as Interest Rates Rise (CNBC.com)
Stocks Selloff Extends as Yields Advance (Bloomberg.com)
And to all this negativity I say...RUBBISH!
That is because in my 8/24/21 commentary I spelled out this bearish argument was devoid of logic and borderline comical. Here it is once again because I don’t believe I could explain it any better:
“What is a “Taper Tantrum”?
This is an overdone stock market sell off that begins when the Fed first signals that they plan to take actions that will raise rates. This gets some hyperactive traders to start selling immediately because they foresee that the tide has turned and there will be more Fed actions to raise rates in the future.
This reaction sounds logical on the surface. But is completely insane given all historical reference points which we will dig into below.
More to the point, when the Fed shifts to a more hawkish view (less accommodation with higher rates likely to follow) the stock market typically goes up for 2-3 more years afterwards. That is the norm.
In this case, rates are so far below normal...that it may take a lot longer than 2-3 years for higher rates to cramp the economy and stock market. Thus, to have any kind of sell off now is irrational and borderline insane.
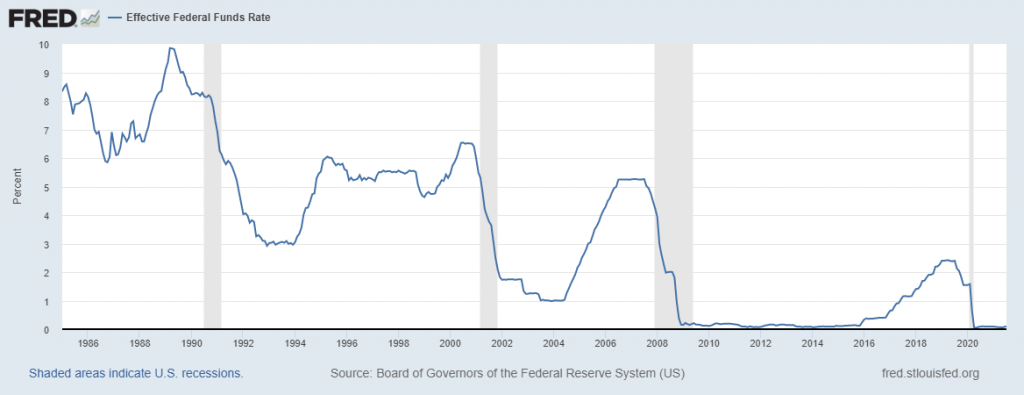
Here is a chart going back over 35 years and 4 bear markets (the gray vertical bars). See how long before the bear markets arrive that the Fed starts moving rates higher. And see how high rates had to go before the bear market began. Meaning the ticker tantrum sell off last week was a downright JOKE. Thus, not a surprise how quickly stocks have rebounded since.
Then it begs the question; Why do these illogical market reactions happen so often?
It comes down to the difference between traders and investors. In particular day traders and computer based trading is a world view compressed to just seconds and minutes. That is opposed to the months or years that the typical investor contemplates.
When your time horizon is that compacted, then you are hyper vigilant to the headlines. There the view becomes binary such as:
More Fed accommodation = Buy
Less Fed accommodation = Sell
These decisions are instant and reflexive with no care or concern for the longer term ramifications. Indeed, looking at the chart above, last week’s sell off would be like bailing out of the stock market 1994 at the first sign of Fed rate hikes even though there was 6 more years of glorious stock gains to follow.
Just to solidify the point, below is the chart which shows the value of the stock market if it was on par with the yield of 10 year Treasuries. This is an important chart because as you will see on the left side, the stock market has been relatively on par with that valuation model between 1979 and 2001. So now picture how much more rates would have to rise to call into question the value of the stock market and end this bull run.
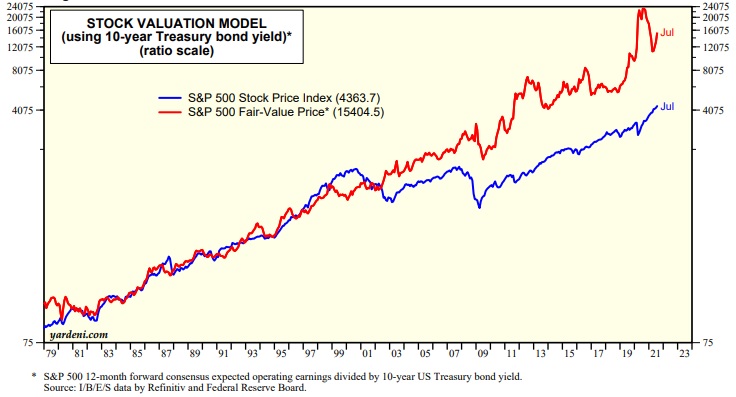
(9/28/21 Edit: This chart may be from end of July #s...but even with rates up to 1.55% the stock market is still the OBSCENELY better value at this stage).
I think you see my point. That rates are so incredibly low creating an undeniable value story for stocks that will NOT be undone anytime soon.
This does not mean to take a second mortgage on your house to put in the stock market.
This does not mean the stock market will just go up and up and up.
This does not mean that there will not be other extended sell offs here or there along the way.
It simply means that the long term market outlook is bullish til proven otherwise. And to undo that we would need to see some great threat to the economy that meant recession with subsequent bear market. Virtually nothing taking place right now points to that outcome which is why a bullish bias is warranted.
Having that clear eyed view in place allowed us to unflinchingly stay in our stocks during the taper tantrum to enjoy some pretty impressive gains since.”
(End of 8/24/21 commentary)
At this stage I just see a lot of pinballing action between the key resistance and support lines. Here is the updated moving average levels:
4,444 = 50 Day Moving Average (which is where the S&P hung out the previous 3 sessions)
4,342 = 100 Day Moving Average (Tuesday’s intraday low of 4,346 flirted with this level)
4,128 = 200 Day Moving Average (not likely to make it down here...but every now and then the market needs a good house cleaning to shake off complacency. This kind of drop would certainly be that wake up call. Yet still plenty of time for stocks to make it to about 4700-4800 before the year ends).
In general economic activity continues to be solid including the PMI Flash at 54.5 with manufacturing much more impressive at 60.5. This strength was corroborated in the Durable Goods report yesterday at 1.8% vs. the 0.4% increase that was expected.
This manufacturing strength displayed in these 2 reports is good to know as some of the lesser followed regional manufacturing reports (KC, Dallas & Richmond) each showed month over month declining growth. So for now I would assume the former reports provide a more accurate read as to what is happening on a national level.
All in all, the preponderance of the evidence remains bullish. And even when we have nasty negative sessions as we have today the lesson learned is to hold onto the reigns of the bull market. That’s because you don’t want to be on the sidelines when it starts to run higher once again.
What To Do Next?
The Reitmeister Total Return portfolio has beaten the market consistently over time. Here are the specifics:
Time Period | RTR Gains | S&P 500 Gains |
| 1 Month | +0.82% | -3.89% |
| 3 Months | +5.41% | +1.42% |
| Year to Date | +29.54% | +15.88% |
1 Year | +49.54% | +30.50% |
Why such a strong outperformance?
Because I hand-pick the very best stocks from across the POWR Ratings universe. In fact right now there are 12 Buy rated stocks and 2 ETFs in the portfolio ready to excel in the days and weeks ahead.
If you would like to see the current portfolio, and get our next trades, then start a 30 day trial by clicking the link below.
About Reitmeister Total Return newsletter & 30 Day Trial
Wishing you a world of investment success!

Steve Reitmeister
…but everyone calls me Reity (pronounced “Righty”)
CEO, Stock News Network and Editor, Reitmeister Total Return
SPY shares were trading at $435.88 per share on Wednesday morning, up $2.16 (+0.50%). Year-to-date, SPY has gained 17.72%, versus a % rise in the benchmark S&P 500 index during the same period.
About the Author: Steve Reitmeister

Steve is better known to the StockNews audience as “Reity”. Not only is he the CEO of the firm, but he also shares his 40 years of investment experience in the Reitmeister Total Return portfolio. Learn more about Reity’s background, along with links to his most recent articles and stock picks.
The post Yet Another “Buy the Dip” Opportunity appeared first on StockNews.com