


BrightView Holdings, Inc. (NYSE: BV) (the “Company” or “BrightView”), the leading commercial landscaping services company in the United States, today reported unaudited results for the third quarter ended June 30, 2021.
This press release features multimedia. View the full release here: https://www.businesswire.com/news/home/20210805005225/en/

(Graphic: Business Wire)
“We are very pleased with an exceptional quarter driven by Maintenance Land organic revenue growth of 11.7%, which was the strongest since our 2018 IPO. Our return to positive organic growth is again a testament to the investments made in our expanded sales teams and sales enablement technologies, and underpins our Adjusted EBITDA improvement. Free Cash Flow generation remained strong, funding our acquisition strategy, which continues to be a reliable and sustainable source of revenue growth” said Andrew Masterman, BrightView President and Chief Executive Officer. “Following a strong first half of fiscal 2021, our talented and seasoned teams continued to overcome labor headwinds, job delays and supply chain challenges to deliver even stronger results in the third quarter. Overall, I am pleased as we continue to successfully execute our strategy and gain strength as a company. I could not be prouder of our 20,000 plus team members or more confident about our future and ability to deliver superior results to all stakeholders.”
Third Quarter Fiscal 2021 Highlights
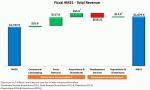
- Total revenue of $673.6 million, a 10.8% increase compared to $608.1 million in the prior year.
-
Maintenance revenue of $524.6 million, a 15.0% increase compared to $456.3 million in the prior year;
- Land revenue of $521.2 million compared to the prior year of $451.2 million underpinned by organic revenue growth of 11.7%.
- Development revenue of $150.3 million, a 1.6% decrease compared to $152.8 million in the prior year.
- Net Income of $25.2 million, or $0.24 per share, compared to Net Loss of $2.4 million, or $(0.02) per share in the prior year; Net Income Margin of 3.7%, an improvement of 410 basis points compared to prior year Net Loss Margin of 0.4%.
- Adjusted EBITDA of $93.6 million, an increase of $2.6 million or 2.9% compared to Adjusted EBITDA of $91.0 million in the prior year; Adjusted EBITDA margin of 13.9%, a decrease of 110 basis points compared to Adjusted EBITDA margin of 15.0% in the prior year.
- Net cash provided by operating activities of $50.0 million and Free Cash Flow generation of $37.3 million.
Nine Months Fiscal 2021 Highlights
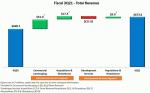
- Total revenue of $1,879.9 million, an 8.2% increase compared to $1,737.9 million in the prior year.
-
Maintenance revenue of $1,478.4 million, a 14.7% increase compared to $1,288.7 million in the prior year;
- Land revenue of $1,193.2 million compared to the prior year of $1,125.6 million underpinned by organic revenue growth of 1.5%;
- Snow revenue of $285.2 million compared to the prior year of $163.1 million.
- Development revenue of $404.7 million, a 10.4% decrease compared to $451.9 million in the prior year.
- Net Income of $19.5 million, or $0.19 per share, and a Net Income Margin of 1.0%, compared to Net Loss of $35.5 million, or ($0.34) per share, and a net loss margin of 2.0%, in the prior year.
- Adjusted EBITDA of $212.8 million, an increase of $31.2 million or 17.2% compared to Adjusted EBITDA of $181.6 million in the prior year; Adjusted EBITDA margin of 11.3%, an increase of 90 basis points compared to Adjusted EBITDA margin of 10.4% in the prior year.
- Net cash provided by operating activities of $133.4 million and Free Cash Flow generation of $96.2 million.
Fiscal 2021 Results – Total BrightView
Total BrightView - Operating Highlights | ||||||||||||||||||||
Three Months Ended
| Nine Months Ended
| |||||||||||||||||||
($ in millions, except per share figures) | 2021 | 2020 | Change | 2021 | 2020 | Change | ||||||||||||||
Revenue | $ | 673.6 | $ | 608.1 | 10.8% | $ | 1,879.9 | $ | 1,737.9 | 8.2% | ||||||||||
Net Income (Loss) | $ | 25.2 | $ | (2.4 | ) | 1,150.0% | $ | 19.5 | $ | (35.5 | ) | 154.9% | ||||||||
Net Income (Loss) Margin | 3.7 | % | (0.4 | %) | 410 bps | 1.0 | % | (2.0 | %) | 300 bps | ||||||||||
Adjusted EBITDA | $ | 93.6 | $ | 91.0 | 2.9% | $ | 212.8 | $ | 181.6 | 17.2% | ||||||||||
Adjusted EBITDA Margin | 13.9 | % | 15.0 | % | (110) bps | 11.3 | % | 10.4 | % | 90 bps | ||||||||||
Adjusted Net Income | $ | 46.6 | $ | 44.0 | 5.9% | $ | 86.7 | $ | 56.5 | 53.5% | ||||||||||
Basic Earnings (Loss) per Share | $ | 0.24 | $ | (0.02 | ) | 1,300.0% | $ | 0.19 | $ | (0.34 | ) | 155.9% | ||||||||
Earnings per Share, Adjusted | $ | 0.44 | $ | 0.42 | 4.8% | $ | 0.82 | $ | 0.55 | 49.1% | ||||||||||
Weighted average number of common shares outstanding | 105.2 | 103.8 | 1.3% | 105.2 | 103.6 | 1.5% | ||||||||||||||
For the third quarter of fiscal 2021, total revenue increased 10.8% to $673.6 million driven principally by an increase in Maintenance Services revenues of $68.3 million. Net Income was $25.2 million compared to Net Loss of $2.4 million in the prior year period. Total Adjusted EBITDA increased $2.6 million, or 2.9%, to $93.6 million from $91.0 million in the prior year period. Maintenance Services Segment Adjusted EBITDA increased $7.3 million, or 8.8%, to $90.6 million compared to $83.3 in the prior year period. Development Services Segment Adjusted EBITDA decreased $3.1 million to $18.7 million from $21.8 million in the prior year period due principally to a decrease in net service revenues. The Segment Adjusted EBITDA results are discussed further below.
For the nine months ended June 30, 2021, total revenue increased 8.2% to $1,879.9 million driven principally by an increase in Maintenance Services revenues of $189.7 million. Net Income was $19.5 million compared to Net Loss of $35.5 million in the prior year period. Total Adjusted EBITDA increased $31.2 million, or 17.2%, to $212.8 million from $181.6 million in the prior year period. Maintenance Services Segment Adjusted EBITDA increased $40.8 million, or 23.8%, to $212.5 million compared to $171.7 million in the prior year period. Development Services Segment Adjusted EBITDA decreased to $46.6 million from $55.1 million in the prior year period due principally to a decrease in net service revenues. The Segment Adjusted EBITDA results are discussed further below.
Fiscal 2021 Results – Segments
Maintenance Services - Operating Highlights | ||||||||||||||||||||
Three Months Ended
| Nine Months Ended
| |||||||||||||||||||
($ in millions) | 2021 | 2020 | Change | 2021 | 2020 | Change | ||||||||||||||
Landscape Maintenance | $ | 521.2 | $ | 451.2 | 15.5% | $ | 1,193.2 | $ | 1,125.6 | 6.0% | ||||||||||
Snow Removal | $ | 3.4 | $ | 5.1 | (33.3%) | $ | 285.2 | $ | 163.1 | 74.9% | ||||||||||
Total Revenue | $ | 524.6 | $ | 456.3 | 15.0% | $ | 1,478.4 | $ | 1,288.7 | 14.7% | ||||||||||
Adjusted EBITDA | $ | 90.6 | $ | 83.3 | 8.8% | $ | 212.5 | $ | 171.7 | 23.8% | ||||||||||
Adjusted EBITDA Margin | 17.3 | % | 18.3 | % | (100) bps | 14.4 | % | 13.3 | % | 110 bps | ||||||||||
Capital Expenditures | $ | 13.3 | $ | 8.0 | 66.3% | $ | 37.5 | $ | 34.0 | 10.3% | ||||||||||
For the third quarter of fiscal 2021, revenue in the Maintenance Services Segment increased by $68.3 million, or 15.0%, from the 2020 period. The increase was primarily driven by a $52.8 million increase in commercial landscape services underpinned by a combination of contract and ancillary services growth, as well as an $18.0 million revenue contribution from acquired businesses.
Adjusted EBITDA for the Maintenance Services Segment for the three months ended June 30, 2021 increased by $7.3 million to $90.6 million from $83.3 million in the 2020 period. The increase in Segment Adjusted EBITDA was principally driven by the increase in Maintenance Services revenues discussed above. Segment Adjusted EBITDA Margin decreased 100 basis points, to 17.3%, in the three months ended June 30, 2021, from 18.3% in the 2020 period, primarily due to higher material costs and increased labor costs inclusive of the Juneteenth company holiday introduced in June 2021.
For the nine months ended June 30, 2021, revenue in the Maintenance Services Segment increased by $189.7 million, or 14.7%, from the 2020 period. Revenues from snow removal services were $285.2 million, an increase of $122.1 million over the 2020 period, and revenues from landscape services were $1,193.2 million, an increase of $67.6 million over the 2020 period. The increase in snow removal services was primarily attributable to the increased frequency of snowfall events and the higher relative snowfall in the nine months ended June 30, 2021 compared to the prior year period. The increase in landscape services revenues was driven by a $53.2 million revenue contribution from acquired businesses and a $16.8 million increase in commercial landscape services underpinned by a combination of contract and ancillary services growth.
Adjusted EBITDA for the Maintenance Services Segment for the nine months ended June 30, 2021 increased $40.8 million, to $212.5 million, compared to $171.7 million in the 2020 period. Segment Adjusted EBITDA Margin increased 110 basis points, to 14.4%, in the nine months ended June 30, 2021, from 13.3% in the 2020 period. The increases in Segment Adjusted EBITDA and Segment Adjusted EBITDA Margin were principally driven by the increase in net service revenues described above and a decrease in Selling, general, and administrative expenses due to cost containment actions.
Development Services - Operating Highlights | ||||||||||||||||||||
Three Months Ended
| Nine Months Ended
| |||||||||||||||||||
($ in millions) | 2021 | 2020 | Change | 2021 | 2020 | Change | ||||||||||||||
Revenue | $ | 150.3 | $ | 152.8 | (1.6%) | $ | 404.7 | $ | 451.9 | (10.4%) | ||||||||||
Adjusted EBITDA | $ | 18.7 | $ | 21.8 | (14.2%) | $ | 46.6 | $ | 55.1 | (15.4%) | ||||||||||
Adjusted EBITDA Margin | 12.4 | % | 14.3 | % | (190) bps | 11.5 | % | 12.2 | % | (70) bps | ||||||||||
Capital Expenditures | $ | 2.7 | $ | 1.6 | 68.8% | $ | 5.0 | $ | 9.5 | (47.4%) | ||||||||||
For the third quarter of fiscal 2021, revenue in the Development Services Segment decreased $2.5 million, or 1.6%, compared to the 2020 period. The decrease in Development Services revenues was principally driven by an $11.6 million reduction due to reduced backlog as a result of the COVID-19 pandemic, coupled with a $5.9 million reduction due to the sale of BrightView Tree Company in September 2020, partially offset by a $14.9 million revenue contribution from acquired businesses.
Adjusted EBITDA for the Development Services Segment for the three months ended June 30, 2021 decreased $3.1 million, to $18.7 million, compared to the 2020 period. Segment Adjusted EBITDA Margin decreased 190 basis points, to 12.4% for the quarter from 14.3% in the 2020 period. Segment Adjusted EBITDA and Segment Adjusted EBITDA Margin decreased due to the decrease in net service revenues described above coupled with higher material costs, partially offset by a decrease in Selling, general, and administrative expenses due to cost containment actions.
For the nine months ended June 30, 2021, revenues for the Development Services Segment decreased $47.2 million, or 10.4%, compared to the 2020 period. The decrease in Development Services revenues was principally driven by a $58.2 million reduction due to reduced backlog as a result of the COVID-19 pandemic, partially offset by a $29.6 million revenue contribution from acquired businesses. In addition, the sale of BrightView Tree Company in September 2020 reduced net service revenues by $18.6 million for the nine months ended June 30, 2021.
Adjusted EBITDA for the Development Services Segment for the nine months ended June 30, 2021 decreased $8.5 million, to $46.6 million, compared to the 2020 period. Segment Adjusted EBITDA Margin decreased 70 basis points to 11.5% in the nine months ended June 30, 2021, from 12.2% in the 2020 period. Segment Adjusted EBITDA and Segment Adjusted EBITDA Margin decreased due to the decrease in net service revenues described above, partially offset by a decrease in Selling, general, and administrative expenses due to cost containment actions.
Total BrightView Cash Flow Metrics | ||||||||||
Nine Months Ended
| ||||||||||
($ in millions) | 2021 | 2020 | Change | |||||||
Net Cash Provided by Operating Activities | $ | 133.4 | $ | 161.9 | (17.6%) | |||||
Free Cash Flow | $ | 96.2 | $ | 119.8 | (19.7%) | |||||
Capital Expenditures | $ | 44.7 | $ | 45.9 | (2.6%) | |||||
Net cash provided by operating activities for the nine months ended June 30, 2021 decreased $28.5 million, to $133.4 million, from $161.9 million in the 2020 period. This decrease was due to a reduction in the cash provided by accounts receivable, unbilled and deferred revenue, and accounts payable and other operating liabilities, partially offset by an increase in cash provided by other operating assets.
Free Cash Flow decreased $23.6 million to $96.2 million for the nine months ended June 30, 2021 from $119.8 million in the 2020 period. The decrease in Free Cash Flow was due to a decrease in cash provided by operating activities, as described above.
For the nine months ended June 30, 2021, capital expenditures were $44.7 million, compared with $45.9 million in the prior year. The Company also generated proceeds from the sale of property and equipment of $7.5 million and $3.8 million during the nine months ended June 30, 2021 and 2020, respectively. Net of the proceeds from the sale of property and equipment, net capital expenditures represented 2.0% and 2.4% of revenue in the nine months ended June 30, 2021 and 2020, respectively.
Total BrightView Balance Sheet Metrics | |||||||||||
($ in millions) | June 30, 2021 | June 30, 2020 | September 30, 2020 | ||||||||
Total Financial Debt1 | $ | 1,173.1 | $ | 1,201.5 | $ | 1,172.3 | |||||
Total Cash & Equivalents | 125.0 | 89.9 | 157.1 | ||||||||
Total Net Financial Debt2 | $ | 1,048.1 | $ | 1,111.6 | $ | 1,015.2 | |||||
Total Net Financial Debt to Adjusted EBITDA ratio3 | 3.5x | 4.1x | 3.7x | ||||||||
1Total Financial Debt includes total long-term debt, net of original issue discount, and finance lease obligations
| |||||||||||
As of June 30, 2021, the Company’s Total Net Financial Debt was $1,048.1 million, a decrease of $63.5 million compared to $1,111.6 million as of June 30, 2020. The Company’s Total Net Financial Debt to Adjusted EBITDA ratio was 3.5x and 4.1x as of June 30, 2021 and June 30, 2020, respectively.
Recent M&A Activity
In June 2021, BrightView acquired Baytree Landscape, a full-service landscaping company based in the southeast market. Founded in 2014, with six primary locations and a skilled labor force of approximately 370 team members, Baytree is recognized as a leader in the southeast market.
Additionally, in June 2021, BrightView acquired West Bay Landscape, a service leader in the desirable Southwest Florida market. The company, with 125 trained personnel, provides a mix of revenue with enhancement and maintenance services, and strengthens our presence in a desirable market.
Conference Call Information
A conference call to discuss the third quarter fiscal 2021 financial results is scheduled for August 5, 2021, at 10 a.m. EDT. The U.S. toll free dial-in for the conference call is (877) 273-7124 and the international dial-in is (647) 689-5396. The conference passcode is 9518947. A live audio webcast of the conference call will be available on the Company’s investor website https://investor.brightview.com, where presentation materials will be posted prior to the call.
A replay of the call will be available from 1 p.m. EDT on August 5, 2021 to 11:59 p.m. EDT on August 12, 2021. To access the recording, dial (800) 585-8367 or (416) 621-4642 (Conference ID 9518947).
About BrightView
BrightView is the largest provider of commercial landscaping services in the United States. Through its team of approximately 20,000 employees, BrightView provides services ranging from landscape maintenance and enhancements to tree care and landscape development for thousands of customers’ properties, including corporate and commercial properties, HOAs, public parks, hotels and resorts, hospitals and other healthcare facilities, educational institutions, restaurants and retail, and golf courses, among others. BrightView is the Official Field Consultant to Major League Baseball.
Forward Looking Statements
This press release contains forward looking statements within the meaning of Section 27A of the Securities Act of 1933, as amended (the “Securities Act”) and Section 21E of the Securities Exchange Act of 1934 that involve substantial risks and uncertainties. All statements, other than statements of historical facts, contained in this presentation, including statements relating to our fourth quarter fiscal 2021 and full year fiscal 2021 guidance and other statements related to our expectations regarding our industry, strategy, future operations, future liquidity and financial position, future revenues, projected costs, prospects, plans and objectives of management, are forward-looking statements. The words such as “outlook,” “guidance,” “projects,” “continues,” “believes,” “expects,” “may,” “will,” “should,” “seeks,” “intends,” “plans,” “estimates,” or “anticipates,” or the negative version of these words or similar expressions are intended to identify forward-looking statements, although not all forward-looking statements contain these identifying words. By their nature, forward-looking statements: speak only as of the date they are made; are not statements of historical fact or guarantees of future performance; and are subject to risks, uncertainties, assumptions, or changes in circumstances that are difficult to predict or quantify. Our expectations, beliefs, and projections are expressed in good faith and we believe there is a reasonable basis for them. However, there can be no assurance that management’s expectations, beliefs and projections will result or be achieved and actual results may vary materially from what is expressed in or indicated by the forward-looking statements. Factors that could cause actual results to differ materially from those projected include, but are not limited to: general business economic and financial conditions; the duration and extent of the novel coronavirus (COVID-19) pandemic and its resurgence, and the impact of federal, state and local governmental actions and customer behavior in response to the pandemic, including possible additional or reinstated restrictions as a result of a resurgence of the pandemic; competitive industry pressures; the failure to retain current customers, renew existing customer contracts and obtain new customer contracts; the failure to enter into profitable contracts, or maintaining customer contracts that are unprofitable; a determination by customers to reduce their outsourcing or use of preferred vendors; the dispersed nature of our operating structure; our ability to implement our business strategies and achieve our growth objectives; acquisition and integration risks; the seasonal nature of our landscape maintenance services; our dependence on weather conditions; increases in prices for raw materials and fuel; changes in our ability to source adequate supplies and materials in a timely manner; any failure to accurately estimate the overall risk, requirements, or costs when we bid on or negotiate contracts that are ultimately awarded to us; the conditions and periodic fluctuations of real estate markets, including residential and commercial construction; our ability to retain our executive management and other key personnel; our ability to attract and retain trained workers and third-party contractors and re-employ seasonal workers; any failure to properly verify employment eligibility of our employees; subcontractors taking actions that harm our business; our recognition of future additional impairment charges; laws and governmental regulations, including those relating to employees, wage and hour, immigration, human health and safety and transportation; environmental, health and safety laws and regulations, including regulatory costs, claims and litigation related to the use of chemicals and pesticides by employees and related third-party claims; the distraction and impact caused by litigation, of adverse litigation judgments and settlements resulting from legal proceedings; increase in on-job accidents involving employees; any failure, inadequacy, interruption, security failure or breach of our information technology systems; our ability to adequately protect our intellectual property; restrictions imposed by our debt agreements that limit our flexibility in operating our business; our ability to generate sufficient cash flow to satisfy our significant debt service obligations; our ability to obtain additional financing to fund future working capital, capital expenditures, investments or acquisitions, or other general corporate requirements; increases in interest rates governing our variable rate indebtedness increasing the cost of servicing our substantial indebtedness including proposed changes to LIBOR; ownership of our common stock; occurrence of natural disasters, terrorist attacks or other external events; changes in generally accepted accounting principles in the United States; and costs and requirements imposed as a result of maintaining the requirement of being a public company. Additional factors that could cause our results to differ materially from those described in the forward-looking statements can be found under “Item 1A. Risk Factors” in our Form 10-K for the fiscal year ended September 30, 2020 as such factors may be updated from time to time in our periodic filings with the SEC, which are accessible on the SEC’s website at www.sec.gov. Accordingly, there are or will be important factors that could cause actual outcomes or results to differ materially from those indicated in these statements. These factors should not be construed as exhaustive and should be read in conjunction with the other cautionary statements that are included in this release and in our filings with the SEC. Any forward-looking statement made in this press release speaks only as of the date on which it was made. We undertake no obligation to publicly update or review any forward-looking statement, whether as a result of new information, future developments or otherwise, except as required by law.
Non-GAAP Financial Measures
To supplement the Company’s financial information presented in accordance with GAAP and aid understanding of the Company’s business performance, the Company uses certain non-GAAP financial measures, namely “Adjusted EBITDA”, “Adjusted EBITDA Margin”, “Adjusted Net Income”, “Adjusted Earnings per Share”, “Free Cash Flow”, Total Financial Debt”, “Total Net Financial Debt” and “Total Net Financial Debt to Adjusted EBITDA ratio”. We believe Adjusted EBITDA, Adjusted EBITDA Margin, Adjusted Net Income, Adjusted Earnings per Share, Free Cash Flow, Total Financial Debt, Total Net Financial Debt, and Total Net Financial Debt to Adjusted EBITDA ratio assist investors and in comparing our results across reporting periods on a consistent basis by excluding items that we do not believe are indicative of our core operating performance. Management believes these non-GAAP financial measures are useful to investors in highlighting trends in our operating performance, while other measures can differ significantly depending on long-term strategic decisions regarding capital structure, the tax jurisdictions in which we operate and capital investments. Management regularly uses these measures as tools in evaluating our operating performance, financial performance and liquidity. Management uses Adjusted EBITDA, Adjusted EBITDA Margin, Adjusted Net Income, Adjusted Earnings per Share, Free Cash Flow, Total Financial Debt, Total Net Financial Debt, and Total Net Financial Debt to Adjusted EBITDA ratio to supplement comparable GAAP measures in the evaluation of the effectiveness of our business strategies, to make budgeting decisions, to establish discretionary annual incentive compensation and to compare our performance against that of other peer companies using similar measures. In addition, we believe that Adjusted EBITDA, Adjusted EBITDA Margin, Adjusted Net Income, Adjusted Earnings per Share, Free Cash Flow, Total Financial Debt, Total Net Financial Debt, and Total Net Financial Debt to Adjusted EBITDA ratio are frequently used by investors and other interested parties in the evaluation of issuers, many of which also present Adjusted EBITDA, Adjusted EBITDA Margin, Adjusted Net Income, Adjusted Earnings per Share, Free Cash Flow, Total Financial Debt, Total Net Financial Debt, and Total Net Financial Debt to Adjusted EBITDA ratio when reporting their results in an effort to facilitate an understanding of their operating and financial results and liquidity. Management supplements GAAP results with non-GAAP financial measures to provide a more complete understanding of the factors and trends affecting the business than GAAP results alone.
Adjusted EBITDA: We define Adjusted EBITDA as net income (loss) before interest, taxes, depreciation and amortization, as further adjusted to exclude certain non-cash, non-recurring and other adjustment items.
Adjusted EBITDA Margin: We define Adjusted EBITDA Margin as Adjusted EBITDA, defined above, divided by Net Service Revenues.
Adjusted Net Income: We define Adjusted Net Income as net income (loss) including interest and depreciation, and excluding other items used to calculate Adjusted EBITDA and further adjusted for the tax effect of these exclusions and the removal of the discrete tax items.
Adjusted Earnings per Share: We define Adjusted Earnings per Share as Adjusted Net Income divided by the weighted average number of common shares outstanding for the period.
Free Cash Flow: We define Free Cash Flow as cash flows from operating activities less capital expenditures, net of proceeds from the sale of property and equipment.
Total Financial Debt: We define Total Financial Debt as total long-term debt, net of original issue discount, and finance/capital lease obligations.
Total Net Financial Debt: We define Total Net Financial Debt as Total Financial Debt minus total cash and cash equivalents.
Total Net Financial Debt to Adjusted EBITDA ratio: We define Total Net Financial Debt to Adjusted EBITDA ratio as Total Net Financial Debt divided by the trailing twelve month Adjusted EBITDA.
Adjusted EBITDA, Adjusted EBITDA Margin, Adjusted Net Income, Adjusted Earnings per Share, Free Cash Flow, Total Financial Debt, Total Net Financial Debt, and Total Net Financial Debt to Adjusted EBITDA ratio are not recognized terms under GAAP and should not be considered as an alternative to net income (loss) or the ratio of net income (loss) to net revenue as a measure of financial performance, cash flows provided by operating activities as a measure of liquidity, or any other performance measure derived in accordance with GAAP. Additionally, these measures are not intended to be a measure of free cash flow available for management’s discretionary use as they do not consider certain cash requirements such as interest payments, tax payments and debt service requirements. The presentations of these measures have limitations as analytical tools and should not be considered in isolation, or as a substitute for analysis of our results as reported under GAAP. Because not all companies use identical calculations, the presentations of these measures may not be comparable to other similarly titled measures of other companies and can differ significantly from company to company.
BrightView Holdings, Inc.
| ||||||||
(in millions)* | June 30,
| September 30,
| ||||||
Assets | ||||||||
Current assets: | ||||||||
Cash and cash equivalents | $ | 125.0 | $ | 157.1 | ||||
Accounts receivable, net | 365.5 | 319.2 | ||||||
Unbilled revenue | 96.6 | 94.6 | ||||||
Other current assets | 57.3 | 62.2 | ||||||
Total current assets | 644.4 | 633.1 | ||||||
Property and equipment, net | 269.0 | 251.5 | ||||||
Intangible assets, net | 207.9 | 221.3 | ||||||
Goodwill | 1,943.3 | 1,859.3 | ||||||
Operating lease assets | 70.0 | 58.8 | ||||||
Other assets | 42.1 | 47.0 | ||||||
Total assets | $ | 3,176.7 | $ | 3,071.0 | ||||
Liabilities and stockholders’ equity | ||||||||
Current liabilities: | ||||||||
Accounts payable | $ | 145.2 | $ | 116.8 | ||||
Current portion of long-term debt | 10.4 | 12.3 | ||||||
Deferred revenue | 53.1 | 57.1 | ||||||
Current portion of self-insurance reserves | 51.7 | 48.4 | ||||||
Accrued expenses and other current liabilities | 219.5 | 197.2 | ||||||
Current portion of operating lease liabilities | 22.0 | 18.3 | ||||||
Total current liabilities | 501.9 | 450.1 | ||||||
Long-term debt, net | 1,121.8 | 1,127.5 | ||||||
Deferred tax liabilities | 48.8 | 38.9 | ||||||
Self-insurance reserves | 97.9 | 102.7 | ||||||
Long-term operating lease liabilities | 54.7 | 47.5 | ||||||
Other liabilities | 39.0 | 32.8 | ||||||
Total liabilities | 1,864.1 | 1,799.5 | ||||||
Stockholders’ equity: | ||||||||
Preferred stock, $0.01 par value; 50,000,000 shares authorized; no shares
| — | — | ||||||
Common stock, $0.01 par value; 500,000,000 shares authorized;
| 1.1 | 1.0 | ||||||
Treasury stock, at cost; 245,000 and 91,000 shares as of
| (3.7 | ) | (2.5 | ) | ||||
Additional paid-in-capital | 1,484.7 | 1,467.8 | ||||||
Accumulated deficit | (168.4 | ) | (187.9 | ) | ||||
Accumulated other comprehensive loss | (1.1 | ) | (6.9 | ) | ||||
Total stockholders’ equity | 1,312.6 | 1,271.5 | ||||||
Total liabilities and stockholders’ equity | $ | 3,176.7 | $ | 3,071.0 | ||||
(*) Amounts may not total due to rounding.
BrightView Holdings, Inc.
| ||||||||||||||
Three Months Ended
| Nine Months Ended
| |||||||||||||
2021 | 2020 | 2021 | 2020 | |||||||||||
(in millions)* | ||||||||||||||
Net service revenues | $ | 673.6 | $ | 608.1 | $ | 1,879.9 | $ | 1,737.9 | ||||||
Cost of services provided | 494.6 | 451.7 | 1,409.2 | 1,306.2 | ||||||||||
Gross profit | 179.0 | 156.4 | 470.7 | 431.7 | ||||||||||
Selling, general and administrative expense | 123.1 | 131.8 | 374.4 | 389.0 | ||||||||||
Amortization expense | 12.6 | 13.6 | 39.0 | 40.6 | ||||||||||
Income from operations | 43.3 | 11.0 | 57.3 | 2.1 | ||||||||||
Other income | 0.8 | 1.7 | 2.8 | 0.4 | ||||||||||
Interest expense | 9.4 | 15.4 | 32.5 | 49.9 | ||||||||||
Income (loss) before income taxes | 34.7 | (2.7 | ) | 27.6 | (47.4 | ) | ||||||||
Income tax expense (benefit) | 9.5 | (0.3 | ) | 8.1 | (11.9 | ) | ||||||||
Net income (loss) | $ | 25.2 | $ | (2.4 | ) | $ | 19.5 | $ | (35.5 | ) | ||||
Income (loss) per share: | ||||||||||||||
Basic | $ | 0.24 | $ | (0.02 | ) | $ | 0.19 | $ | (0.34 | ) | ||||
Diluted | $ | 0.24 | $ | (0.02 | ) | $ | 0.18 | $ | (0.34 | ) | ||||
BrightView Holdings, Inc.
| ||||||||||||||||
Three Months Ended
| Nine Months Ended
| |||||||||||||||
2021 | 2020 | 2021 | 2020 | |||||||||||||
(in millions)* | ||||||||||||||||
Maintenance Services | $ | 524.6 | $ | 456.3 | $ | 1,478.4 | $ | 1,288.7 | ||||||||
Development Services | 150.3 | 152.8 | 404.7 | 451.9 | ||||||||||||
Eliminations | (1.3 | ) | (1.0 | ) | (3.2 | ) | (2.7 | ) | ||||||||
Net service revenues | $ | 673.6 | $ | 608.1 | $ | 1,879.9 | $ | 1,737.9 | ||||||||
Maintenance Services | $ | 90.6 | $ | 83.3 | $ | 212.5 | $ | 171.7 | ||||||||
Development Services | 18.7 | 21.8 | 46.6 | 55.1 | ||||||||||||
Corporate | (15.7 | ) | (14.1 | ) | (46.3 | ) | (45.2 | ) | ||||||||
Adjusted EBITDA | $ | 93.6 | $ | 91.0 | $ | 212.8 | $ | 181.6 | ||||||||
Maintenance Services | $ | 13.3 | $ | 8.0 | $ | 37.5 | $ | 34.0 | ||||||||
Development Services | 2.7 | 1.6 | 5.0 | 9.5 | ||||||||||||
Corporate | 0.8 | 1.2 | 2.2 | 2.4 | ||||||||||||
Capital expenditures | $ | 16.8 | $ | 10.8 | $ | 44.7 | $ | 45.9 | ||||||||
(*) Amounts may not total due to rounding.
BrightView Holdings, Inc.
| ||||||||
Nine Months Ended
| ||||||||
2021 | 2020 | |||||||
(in millions)* | ||||||||
Cash flows from operating activities: | ||||||||
Net income (loss) | $ | 19.5 | $ | (35.5 | ) | |||
Adjustments to reconcile net income (loss) to net cash provided by operating activities: | ||||||||
Depreciation | 63.6 | 60.4 | ||||||
Amortization of intangible assets | 39.0 | 40.6 | ||||||
Amortization of financing costs and original issue discount | 2.8 | 2.8 | ||||||
Deferred taxes | 7.7 | (17.2 | ) | |||||
Equity-based compensation | 15.4 | 17.9 | ||||||
Realized loss on hedges | 5.3 | 13.1 | ||||||
Other non-cash activities, net | (2.2 | ) | 2.5 | |||||
Change in operating assets and liabilities: | ||||||||
Accounts receivable | (29.9 | ) | 5.6 | |||||
Unbilled and deferred revenue | (6.3 | ) | 39.9 | |||||
Other operating assets | 11.0 | (19.0 | ) | |||||
Accounts payable and other operating liabilities | 7.5 | 50.8 | ||||||
Net cash provided by operating activities | 133.4 | 161.9 | ||||||
Cash flows from investing activities: | ||||||||
Purchase of property and equipment | (44.7 | ) | (45.9 | ) | ||||
Proceeds from sale of property and equipment | 7.5 | 3.8 | ||||||
Business acquisitions, net of cash acquired | (106.2 | ) | (86.5 | ) | ||||
Other investing activities, net | 0.4 | 1.0 | ||||||
Net cash (used) by investing activities | (143.0 | ) | (127.6 | ) | ||||
Cash flows from financing activities: | ||||||||
Repayments of finance lease obligations | (12.3 | ) | (6.3 | ) | ||||
Repayments of term loan | (7.8 | ) | (7.8 | ) | ||||
Repayments of receivables financing agreement | (24.6 | ) | (50.0 | ) | ||||
Repayments of revolving credit facility | — | (70.0 | ) | |||||
Proceeds from receivables financing agreement, net of issue costs | 24.0 | 80.0 | ||||||
Proceeds from revolving credit facility | — | 70.0 | ||||||
Proceeds from issuance of common stock, net of share issuance costs | 1.4 | 0.1 | ||||||
Repurchase of common stock and distributions | (1.2 | ) | (0.9 | ) | ||||
Other financing activities, net | (2.0 | ) | 1.4 | |||||
Net cash (used) provided by financing activities | (22.5 | ) | 16.5 | |||||
Net change in cash and cash equivalents | (32.1 | ) | 50.8 | |||||
Cash and cash equivalents, beginning of period | 157.1 | 39.1 | ||||||
Cash and cash equivalents, end of period | $ | 125.0 | $ | 89.9 | ||||
Supplemental Cash Flow Information: | ||||||||
Cash paid for income taxes, net | $ | 3.8 | $ | 3.9 | ||||
Cash paid for interest | $ | 31.1 | $ | 47.7 | ||||
(*) Amounts may not total due to rounding.
BrightView Holdings, Inc.
| ||||||||||||||||
Three Months Ended
| Nine Months Ended
| |||||||||||||||
(in millions)* | 2021 | 2020 | 2021 | 2020 | ||||||||||||
Adjusted EBITDA | ||||||||||||||||
Net income (loss) | $ | 25.2 | $ | (2.4 | ) | $ | 19.5 | $ | (35.5 | ) | ||||||
Plus: | ||||||||||||||||
Interest expense, net | 9.4 | 15.4 | 32.5 | 49.9 | ||||||||||||
Income tax expense (benefit) | 9.5 | (0.3 | ) | 8.1 | (11.9 | ) | ||||||||||
Depreciation expense | 21.3 | 20.9 | 63.6 | 60.4 | ||||||||||||
Amortization expense | 12.6 | 13.6 | 39.0 | 40.6 | ||||||||||||
Establish public company financial reporting compliance (a) | — | — | — | 0.9 | ||||||||||||
Business transformation and integration costs (b) | 7.2 | 8.2 | 20.0 | 25.8 | ||||||||||||
Offering-related expenses (c) | 0.3 | 2.6 | 0.5 | 4.1 | ||||||||||||
Equity-based compensation (d) | 5.3 | 4.9 | 15.5 | 18.2 | ||||||||||||
COVID-19 related expenses (e) | 2.8 | 4.0 | 14.1 | 5.0 | ||||||||||||
Changes in self-insured liability estimates (f) | — | 24.1 | — | 24.1 | ||||||||||||
Adjusted EBITDA | $ | 93.6 | $ | 91.0 | $ | 212.8 | $ | 181.6 | ||||||||
Adjusted Net Income | ||||||||||||||||
Net income (loss) | $ | 25.2 | $ | (2.4 | ) | $ | 19.5 | $ | (35.5 | ) | ||||||
Plus: | ||||||||||||||||
Amortization expense | 12.6 | 13.6 | 39.0 | 40.6 | ||||||||||||
Establish public company financial reporting compliance (a) | — | — | — | 0.9 | ||||||||||||
Business transformation and integration costs (b) | 7.2 | 8.2 | 20.0 | 25.8 | ||||||||||||
Offering-related expenses (c) | 0.3 | 2.6 | 0.5 | 4.1 | ||||||||||||
Equity-based compensation (d) | 5.3 | 4.9 | 15.5 | 18.2 | ||||||||||||
COVID-19 related expenses (e) | 2.8 | 4.0 | 14.1 | 5.0 | ||||||||||||
Changes in self-insured liability estimates (f) | — | 24.1 | — | 24.1 | ||||||||||||
Income tax adjustment (g) | (6.8 | ) | (11.0 | ) | (21.9 | ) | (26.7 | ) | ||||||||
Adjusted Net Income | $ | 46.6 | $ | 44.0 | $ | 86.7 | $ | 56.5 | ||||||||
Free Cash Flow | ||||||||||||||||
Cash flows from operating activities | $ | 50.0 | $ | 76.2 | $ | 133.4 | $ | 161.9 | ||||||||
Minus: | ||||||||||||||||
Capital expenditures | 16.8 | 10.8 | 44.7 | 45.9 | ||||||||||||
Plus: | ||||||||||||||||
Proceeds from sale of property and equipment | 4.1 | 1.1 | 7.5 | 3.8 | ||||||||||||
Free Cash Flow | $ | 37.3 | $ | 66.5 | $ | 96.2 | $ | 119.8 | ||||||||
(*) Amounts may not total due to rounding.
BrightView Holdings, Inc.
Reconciliation of GAAP to Non-GAAP Financial Measures
(Unaudited)
(a) Represents costs incurred to establish public company financial reporting compliance, including costs to comply with the requirements of Sarbanes-Oxley and the accelerated adoption of the revenue recognition standard (ASC 606 – Revenue from Contracts with Customers), and other miscellaneous costs.
(b) Business transformation and integration costs consist of (i) severance and related costs; (ii) vehicle fleet rebranding costs; (iii) business integration costs and (iv) information technology infrastructure, transformation costs, and other.
Three Months Ended
| Nine Months Ended
| |||||||||||
(in millions)* | 2021 | 2020 | 2021 | 2020 | ||||||||
Severance and related costs | $ | 0.1 | $ | 2.7 | $ | 0.3 | $ | 3.3 | ||||
Business integration (h) | 3.4 | 1.8 | 9.2 | 10.6 | ||||||||
IT infrastructure, transformation, and other (i) | 3.7 | 3.7 | 10.5 | 11.9 | ||||||||
Business transformation and integration costs | $ | 7.2 | $ | 8.2 | $ | 20.0 | $ | 25.8 | ||||
(c) Represents expenses incurred for IPO related litigation and completed or contemplated subsequent registration statements.
(d) Represents equity-based compensation expense and related taxes recognized for equity incentive plans outstanding.
(e) Represents expenses related to the Company’s response to the COVID-19 pandemic, principally temporary and incremental salary and related expenses, personal protective equipment and cleaning and supply purchases, and other.
(f) Represents expenses related to changes in estimates and actuarial assumptions associated with the Company’s self-insured liability amounts for workers’ compensation, general liability, auto liability, and employee health care insurance programs, to reflect uncertainties associated with the current environment, including the COVID-19 pandemic.
(g) Represents the tax effect of pre-tax items excluded from Adjusted Net Income and the removal of the applicable discrete tax items, which collectively result in a reduction of income tax. The tax effect of pre-tax items excluded from Adjusted Net Income is computed using the statutory rate related to the jurisdiction that was impacted by the adjustment after taking into account the impact of permanent differences and valuation allowances. Discrete tax items include changes in laws or rates, changes in uncertain tax positions relating to prior years and changes in valuation allowances.
Three Months Ended
| Nine Months Ended
| ||||||||||||
(in millions)* | 2021 | 2020 | 2021 | 2020 | |||||||||
Tax impact of pre-tax income adjustments | $ | 6.9 | $ | 5.3 | $ | 21.6 | $ | 20.8 | |||||
Discrete tax items | (0.1 | ) | 5.7 | 0.3 | 5.9 | ||||||||
Income tax adjustment | $ | 6.8 | $ | 11.0 | $ | 21.9 | $ | 26.7 | |||||
(h) Represents isolated expenses specifically related to the integration of acquired companies such as one-time employee retention costs, employee onboarding and training costs, and fleet and uniform rebranding costs. The Company excludes Business integration costs from the measures disclosed above since such expenses vary in amount due to the number of acquisitions and size of acquired companies as well as factors specific to each acquisition, and as a result lack predictability as to occurrence and/or timing, and create a lack of comparability between periods.
(i) Represents expenses related to distinct initiatives, typically significant enterprise-wide changes. Such expenses are excluded from the measures disclosed above since such expenses vary in amount based on occurrence as well as factors specific to each of the activities, are outside of the normal operations of the business, and create a lack of comparability between periods.
Total Financial Debt and Total Net Financial Debt | ||||||||||||
(in millions)* | June 30,
| June 30,
| September 30,
| |||||||||
Long-term debt, net | $ | 1,121.8 | $ | 1,159.1 | $ | 1,127.5 | ||||||
Plus: | ||||||||||||
Current portion of long-term debt | 10.4 | 10.4 | 12.3 | |||||||||
Financing costs, net | 11.9 | 14.7 | 13.9 | |||||||||
Present value of net minimum payment - finance lease obligations (j) | 29.0 | 17.3 | 18.6 | |||||||||
Total Financial Debt | 1,173.1 | 1,201.5 | 1,172.3 | |||||||||
Less: Cash and cash equivalents | (125.0 | ) | (89.9 | ) | (157.1 | ) | ||||||
Total Net Financial Debt | $ | 1,048.1 | $ | 1,111.6 | $ | 1,015.2 | ||||||
Total Net Financial Debt to Adjusted EBITDA ratio | 3.5x | 4.1x | 3.7x | |||||||||
(*) Amounts may not total due to rounding.
(j) Balance is presented within Accrued expenses and other current liabilities and Other liabilities in the Consolidated Balance Sheet.
View source version on businesswire.com: https://www.businesswire.com/news/home/20210805005225/en/
Contacts:
John E. Shave, VP of Investor Relations
484.567.7148
John.Shave@BrightView.com
