


The Trend Asset Allocation Model is an asset allocation model that applies trend following principles based on the inputs of global stock and commodity price. This model has a shorter time horizon and tends to turn over about 4-6 times a year. The performance and full details of a model portfolio based on the out-of-sample signals of the Trend Model can be found here.

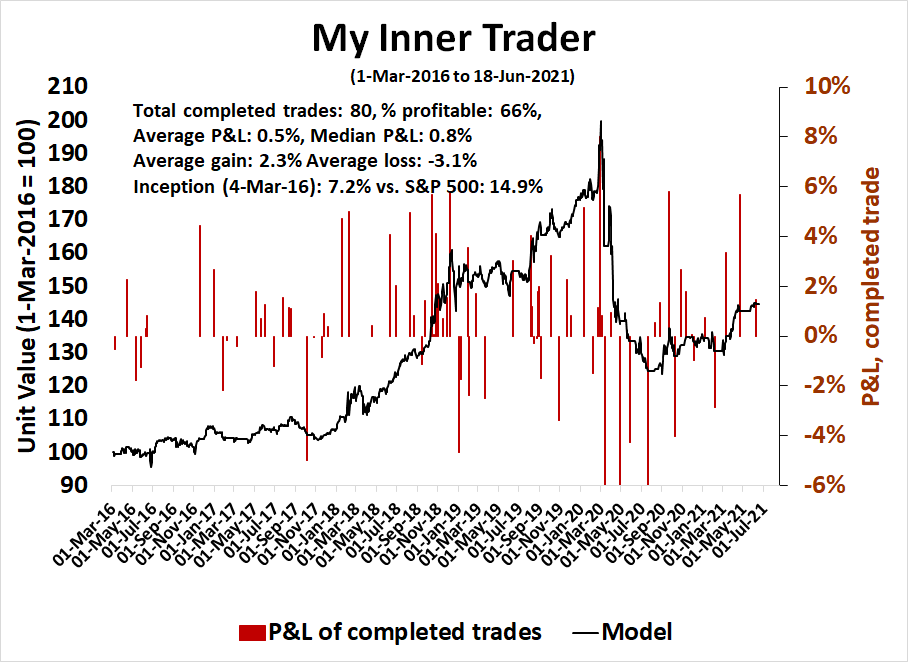
My inner trader uses a trading model, which is a blend of price momentum (is the Trend Model becoming more bullish, or bearish?) and overbought/oversold extremes (don't buy if the trend is overbought, and vice versa). Subscribers receive real-time alerts of model changes, and a hypothetical trading record of the email alerts is updated weekly here. The hypothetical trading record of the trading model of the real-time alerts that began in March 2016 is shown below.
The latest signals of each model are as follows:
- Ultimate market timing model: Buy equities*
- Trend Model signal: Bullish*
- Trading model: Neutral*
Update schedule: I generally update model readings on my site on weekends and tweet mid-week observations at @humblestudent. Subscribers receive real-time alerts of trading model changes, and a hypothetical trading record of those email alerts is shown here.
Subscribers can access the latest signal in real-time here.
The Fed's hawkish pivotHow should investors interpret the Fed's unexpected hawkish turn? The 10-year Treasury yield rose dramatically after the FOMC meeting, but retreated after the initial surge. The S&P 500 fell in the wake of the Fed announcement. While did violate an important downtrend, the violation needs to be confirmed in light of Friday's triple witching expiry volatility.

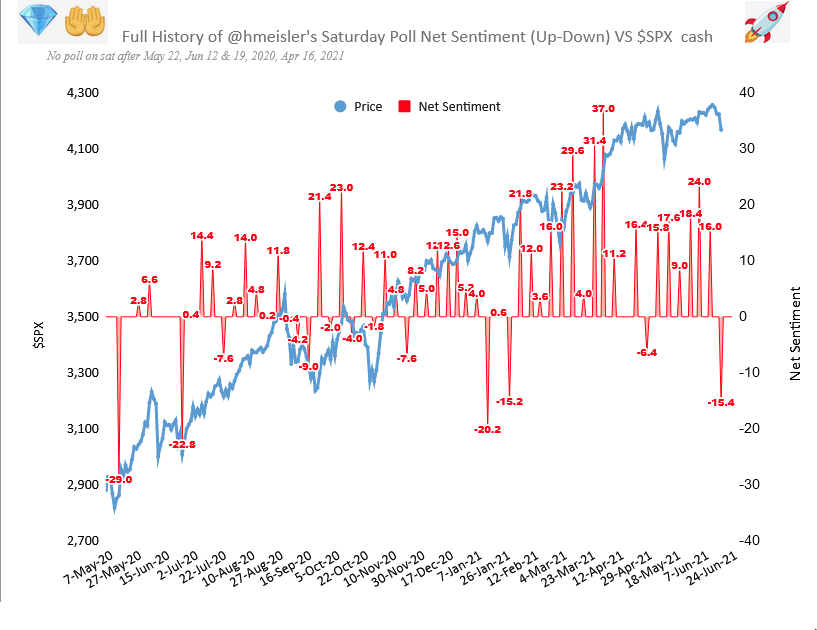
Helene Meisler's weekly (unscientific) Twitter sentiment poll took a 30 point tumble from net bullish to net bearish. Indeed, Fed Chair Jay Powell has managed to the children.
Will that be enough to put a floor on stock prices?
The full post can be found here.
