


A head and shoulders pattern has developed in the chart of Alnylam Pharmaceuticals Inc. (ALNY) and a breakdown is expected soon.
ALNY is a development-stage biopharmaceutical company focused on the development of novel therapeutics based on RNA interference (RNAi). The company’s pipeline of solutions is focused across three therapeutic areas: genetic medicines, cardio-metabolic disease, and hepatic infectious disease.
The company recently posted its latest financial results with earnings well under estimates and down year over year, but revenue outperformed and was up 79.6% from the prior year period. While the company has a broad pipeline of therapeutic candidates, most are in the early stages of development.
ALNY has a strong history of revenue growth, but has not had positive income over the last ten years. Though it does have a strong balance sheet with $1.8 billion in cash at the end of the quarter. While its gross margin is 83.2%, its net margin is a negative 222.2%.
The stock has a high valuation, with a Price to Sales ratio of 35.2 and a Price to Book ratio of 11.8. It has shown bearish short and mid-term momentum, but is up for the year. This has led to a “Neutral” rating in our POWR Ratings system, with a grade of D” in Trade Grade.
Take a look at the 1-year chart of ALNY below with the added notations:
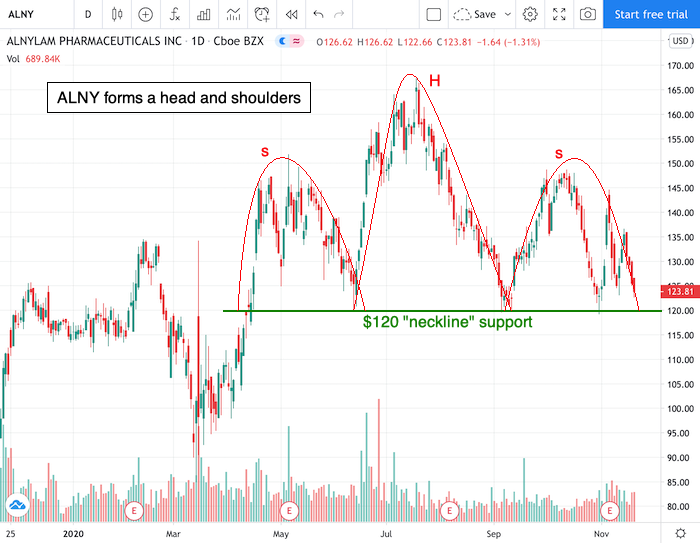
Over the past eight months, ALNY has created a major level of support at $120 (green). That line is also the “neckline” for the stock’s head and shoulders pattern (red).
Confirmation of the head and shoulders pattern would occur if ALNY were to break the support, and lower prices would be expected from there. This bearish pattern implies a short trade to be entered on a break below the $120 neckline.
Want to Discover More Great Trades?
I have explored virtually every flavor of technical analysis and chart pattern known to mankind. The sad fact is that the vast majority of them don’t work at all.
That is why I recently put together this special report to help investors focus on the only 5 chart patterns that matter…the ones that lead to the most timely and profitable stock trades. Click below to get your copy now!
5 WINNING Stock Chart Patterns
Have a good trading day!
Good luck!
Christian Tharpe, CMT
ALNY shares rose $0.19 (+0.15%) in premarket trading Friday. Year-to-date, ALNY has gained 7.67%, versus a 12.76% rise in the benchmark S&P 500 index during the same period.
About the Author: Christian Tharp, CMT

Christian is an expert stock market coach at the Adam Mesh Trading Group who has mentored more than 4,000 traders and investors. He is a professional technical analyst that is a certified Chartered Market Technician (CMT), which is a designation awarded by the CMT Association. Christian is also the author of the daily online newsletter Todays Big Stock.
The post The Bearish Case for Alnylam Pharmaceuticals appeared first on StockNews.com