


There’s no denying the first half of 2020 was a wild one from but a societal and financial standpoint.
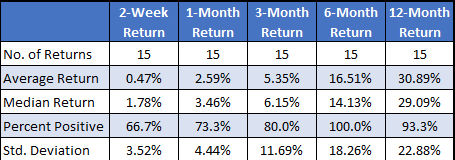
Historically speaking, “v” bottoms bode well for future returns over the next 6-12 months. The typical six-month return for the index is around 6%. Every time frame below shows a higher average return and percent positive than what is typical for the index. This means it is a good time to buy stocks.
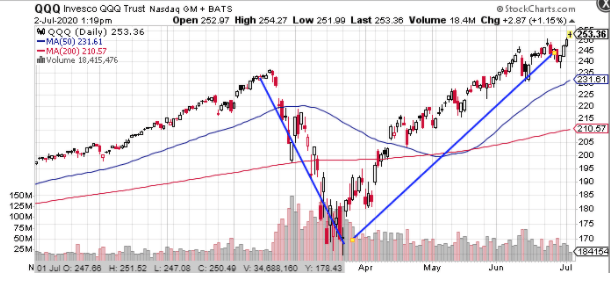
On the financial front, we’ve witnessed the steepest and quickest bear market, a full 35% decline in a mere five weeks, only to only be followed by the best 50-day performance ever; a rocket right back up to highs. If there ever was a picture of a ‘V” bottom in the finance books the chart from March to June would be prominently placed. On the other hand, the stock market recovery has left plenty of pundits scratching their heads as they point to still record unemployment, souring bankruptcy filings, and the mere fact the Covoid-19 virus is still spreading causing not just delays in reopening but actual backtracking of re-closing.
So, what gives?
We’ve had a variety of discussions regarding the disconnect between Wall Street and Main Street and have tried to make clear how the stock market, which mega-cap stocks such as “APPLE (AAPL)” “Microsoft (MSFT)” and “Amazon (AMZN)” comprise some 20% of the “SPDR 500 ETF (SPY)” and a whopping 42% of “Nasdaq (QQQ)”, these are what moves the indices; the local diner and barber are but a mere pimple on the global financial stage.
To beat a dead horse, while the stock market has recouped, much of its losses from the first half of the year, it’s important to keep in mind that the market is not the economy. Financial markets tend to be forward-looking, reflecting what the future may hold. The economy today, however, is far from fully recovered. But, it might not be all doom and gloom on Main Street. Today’s employment report showed a second straight month of record jobs added, some 4.8 million. And while this unemployment rate remains stubbornly above 11%, a level associated with the recession, the pace of recovery is impressive.
More importantly, is the fact the jobs coming back are mostly in the industries that were hardest hurt; namely hotels, airlines, retail and other leisure, and hospitality workers. This suggests that Main Street might not be on the pace of the stock market’s ‘V’ --which does tend to be forward-looking—but the trajectory is providing reasons for optimism.
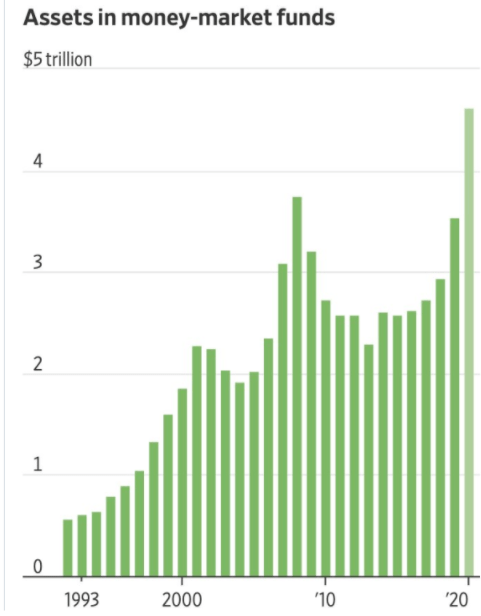
Another reason to feel bullish is the fact most consumers are flush with cash, ready to push back into the economy or the stock market. According to an article in the Wall Street Journal investors are now sitting on a record amount of cash with nearly $5 trillion in money market funds; the highest level in over 25 years. This huge cash hoard is likely a combination of the massive fiscal and monetary stimulus injected into everything from the bond market, businesses, and individuals in an attempt to tie them over during the shutdown. And let’s face it, for individuals that were able to keep their jobs and work remotely, they basically had nowhere to spend their money so it created forced savings.
This represents a tremendous amount of firepower which could push stocks to new record highs.
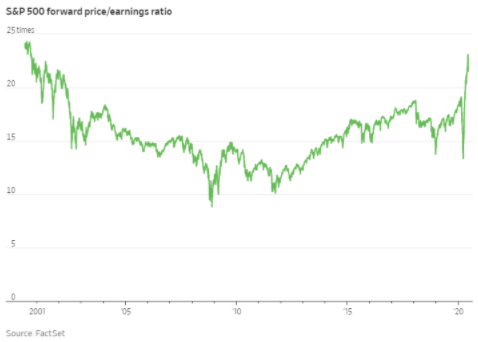
But, buyers need to be aware that they are no longer buying at a discount. Here was the price/earnings ratio since late 2000. We know how it ended.
The second half of 2020 is shaping up to be one of the more challenging, but potentially opportunity periods, for astute traders and investors. My advice, keep some powder dry, utilize options to limit risk, and as always, don’t fight the fed.
To learn more about Steve Smith’s unique approach to trading and to access his Option360 program, click here.
SPY shares were trading at $314.20 per share on Thursday afternoon, up $3.68 (+1.19%). Year-to-date, SPY has declined -1.37%, versus a % rise in the benchmark S&P 500 index during the same period.
About the Author: Steve Smith

Steve has more than 30 years of investment experience with an expertise in options trading. He’s written for TheStreet.com, Minyanville and currently for Option Sensei. Learn more about Steve’s background, along with links to his most recent articles.
The post Where Is the Stock Market Headed in the Second Half of 2020? appeared first on StockNews.com