


 ( click to enlarge )
Celldex Therapeutics, Inc. (NASDAQ:CLDX) had been consolidating its recent run-up over the last 6 sessions, with the 12 level being lateral resistance. The stock broke above that level on Friday and looks poised to continue the uptrend. The MACD has crossed over and is diverging to the upside. The RSI is also pointing up supporting the move. With indicators pointing up, I expect it to test the 50-day EMA at some point over the next few sessions.
 ( click to enlarge )
Esperion Therapeutics Inc (NASDAQ:ESPR) has been basing after a steep decline from a high of over 50 to a low under 19. The stock, which rose 3.40% Friday to 24.96 is at a resistance level and may see an upside reversal off the base. From a technical standpoint, the MACD is also about to trigger buy signal which will be bullish and the RSI has bounced off of 30, a sign of an emerging uptrend. My target on a break above this level is the 30 area. Stop is 22.96.
 ( click to enlarge )
BlackBerry Ltd (NASDAQ:BBRY) has outperformed the market in the past week with a rise of over 16.9%. The share prices have since hit the 52-week low of 5.96 in late September recovered strongly driven by the smart money. Based on the weekly chart above, the MACD is once again curling up and should soon flash the buy signal. If stock history repeats and this pattern plays out in the bulls favor, we might see a rally towards 10 over the course of next several weeks. Please note: BlackBerry and Google will host a Webinar, Thursday October 15 at 11am ET to discuss the Android management in the enterprise with BES12 and Android for Work. It's the perfect catalyst for next week.
 ( click to enlarge )
Apple Inc. (NASDAQ:AAPL) closed up $2.62, or more than 2%, on Friday to 112.12. The move broke the stock out of a trading range and above its 20-day exp moving average of $111.84 on decent volume. A move above 112.28 (Friday's high) would confirm the breakout and point next to a target zone of 114.11 to 116.89. Daily technical indicators on chart are turning bullish. The MACD has moved up to touch its signal line in negative territory and RSI is about to cross up the 50% level. These signs indicate that the stock price may go up in coming days/weeks.
 ( click to enlarge )
Plug Power Inc (NASDAQ:PLUG) On Friday decisively broke out and closed above a key resistance zone with good volume, which is considered to be a bullish sign. Plus, all three major short-term EMAs are rising and the stock is trading above them, which means the bulls are back in control after a sharp correction. A continuation of the rally is likely, targeting 2.85.
 ( click to enlarge )
Ballard Power Systems Inc. (NASDAQ:BLDP) Go long when it clears 1.62 on volume. The daily technical chart still shows bullish sign as the stock is trading above 9,13,20,50 and 100 EMAs. The other technical indicators such as MACD and RSI also show buy signal as MACD is above 0 and RSI line is above the 50% level. Long setup.
 ( click to enlarge )
ITT Educational Services, Inc. (NYSE:ESI) is still holding up well here and the stock has a chance to move higher. Keep this one on your watch list, it could be setting up to break out of this triangle formation. Short squeeze candidate for next week. I believe there are lot of profits left on the table for traders to capitalize on.
 ( click to enlarge )
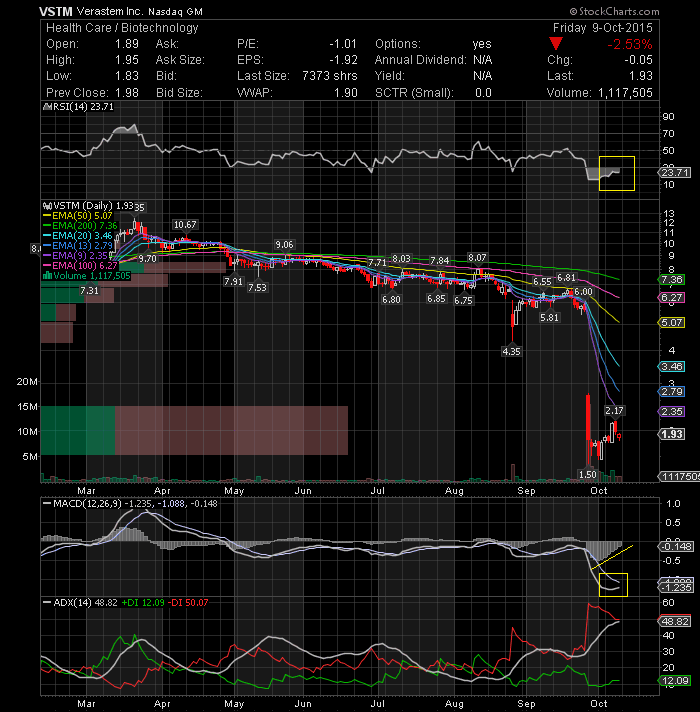
Verastem Inc (NASDAQ:VSTM) All bad news are priced in IMO. Furthermore, the company has a lot of cash at its disposal 132.09M ($3.58 per share) and zero debt. With the stock trading at extreme oversold conditions and momentum oscillators exhibiting positive divergences we can see a strong bounce back towards the 9day exp moving average where the stock might find some kind of resistance.
Disclaimer : This is not an investment advisory, and should not be used to make investment decisions. Information in AC Investor Blog is often opinionated and should be considered for information purposes only. No stock exchange anywhere has approved or disapproved of the information contained herein. There is no express or implied solicitation to buy or sell securities. The charts provided here are not meant for investment purposes and only serve as technical examples. Don't consider buying or selling any stock without conducting your own due diligence.
Thanks for visiting AC Investor Blog.
AC
