


 ( click to enlarge )
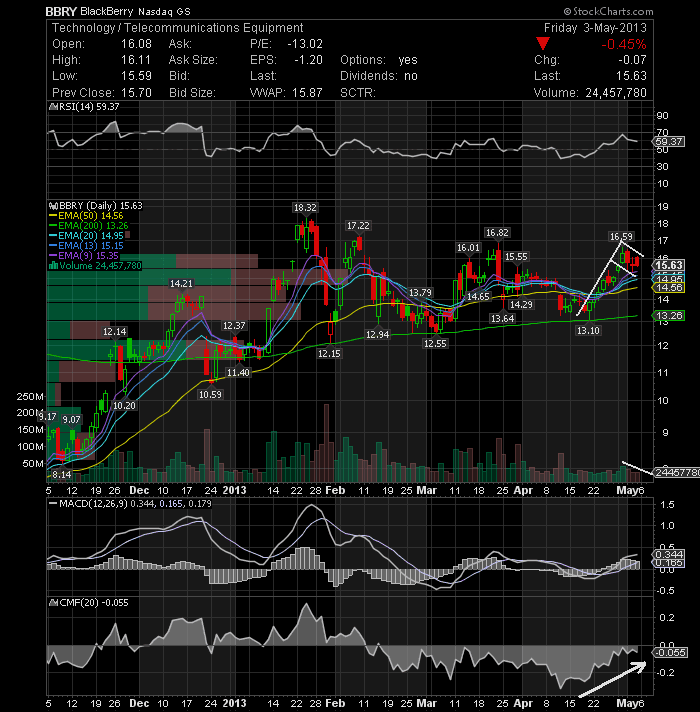
I have been following Research In Motion Ltd (NASDAQ:BBRY) for the past weeks and this might be a rewarding stock if a break out happens. The technical indicators are looking bullish. The MACD is positive and above its signal line. The RSI is above its neutrality area at 50 and the CMF is rising and about to cross zero, for the first time since February. We can also see that the 20EMA has crossed over the 50EMA in April and the stock is now flagging above its 9EMA. At this point, there are still plenty of "Bears" who do not believe in this rally. In my opinion, it appears that the big money is about to dive into the long side, as the technicals indicate that BBRY is poised to move higher, possibly a lot higher due to the high short interest. As long as the stock does not go below the 20EMA or around 15 price level, this stock is a good candidate to BUY, considering the possible flag pattern. Keep the stock in your radar.
 ( click to enlarge )
Silicon Image, Inc.(NASDAQ:SIMG) broke out to new highs last week on 2x the daily avg. volume, which is very positive. I want to see more follow through from this stock next week. Looks good for higher prices.
 ( click to enlarge )
GT Advanced Technologies Inc (NASDAQ:GTAT) seems to be a promising stock to follow. After Friday's 4.63% jump to $3.84 per share, the technical chart is still showing the same trend as stock is still on top of 20-day and 50-day exponential moving average with MACD on top of signal line. In addition, OBV is confirming the strong uptrend. If we see follow-through Monday, it might run hard.
 ( click to enlarge )
Immersion Corporation (NASDAQ:IMMR) displayed some impressive relative strength with a 12.73% gain. After consolidating in between the 11.99 resistance and the 10 support for over seven weeks, the stock finally broke out from its consolidation on expanding volume and marked a new 52 week high of 12.75. Looks good for higher prices.
 ( click to enlarge )
FormFactor, Inc. (NASDAQ:FORM) The 5- 5.1 area is a critical resistance region that can determine overall bias for the stock in short-term. Fundamentals are strong are technicals are improving, holding the 50EMA, all positive. Keep on watch list.
 ( click to enlarge )
Shares of American International Group Inc (NYSE:AIG) broke out to new highs for the year accompained by a strong volume suggesting higher levels. The stock hit a high of 44.9 which is now resistance for Monday’s follow through move.
During the day I tweet many times to my readers. I encourage everybody to subscribe AC Investor Blog twitter and newsletter, so you can receive my trade ideas and stock news in real time.
Disclaimer : This is not an investment advisory, and should not be used to make investment decisions. Information in AC Investor Blog is often opinionated and should be considered for information purposes only. No stock exchange anywhere has approved or disapproved of the information contained herein. There is no express or implied solicitation to buy or sell securities. The charts provided here are not meant for investment purposes and only serve as technical examples. Don't consider buying or selling any stock without conducting your own due diligence.
Thanks for visiting AC Investor Blog.
AC
