


Peabody Energy Co. (NYSE: BTU) is the nation's largest coal producer supplying energy producers like utilities and steel. The popular decarbonization movement has accelerated the adoption of clean and renewable energy sources. However, coal remains the third-largest energy source for electricity generation in the U.S. Despite uncertain macroeconomic conditions, steel demand is robustly driven by infrastructure spending and the automotive industry.
Steel is up 12% year-to-date (YTD) as tracked by the VanEck Steel ETF (NYSEARCA: SLX), while Peabody Energy stock is down (13%) YTD. It competes with Arch Resources Inc. (NYSE: ARCH) and Alliance Resource Partners LP (NASDAQ: ARLP).
Embracing the Renewable and Clean Energy
The company has diversified to partake in the renewable energy trend. It’s invested in carbon capture and storage (CCS) technology, which captures and stores emissions from coal-fired power plants to store underground. Peabody started R3 Renewables, a joint venture with Riverstone Credit Partners and Summit Partners Credit Advisors, that develops large-scale solar and storage on reclaimed mining land.
Over the next five years, it plans to develop over 3.3 GW of solar energy and 1.6 GW of battery storage capacity from former mine sites.
R3 Renewables will be engaged in six sites on previous coal mining operations in Indiana and Illinois. They are located in proximity to grid injection points. The seaborne metallurgical (met) segment shipped 1.3 million tons at an average price of $220.60 per ton, while total segment costs were $151.13 per ton, up 18%, largely impacted by FX headwinds. PRB segment shipped 22 million tons at an average price of $13.89 per ton, with costs averaging $12.26 per ton.
Earnings Burning Hot
On April 27, 2023, Peabody reported its first quarter 2023 results for the quarter ending March 2023. The Company reported earnings-per-share (EPS) of $1.68, beating consensus analyst estimates of $1.23 by $0.35. Net income was $268.5 million compared to a net loss of $119.5 million in the year-ago period.
Adjusted EBITDA was $390.6 million, up 20% YoY. Revenues grew 97.3% year-over-year (YoY) to $1.46 billion, beating analyst estimates of $1.23 billion. Peabody retired $1.5 billion in secured debt. The company initiated a $1 billion stock buyback program.
Outlook for Q2 2023
Peabody expects seaborne thermal volumes of around 4 million tons. Seaborne met volumes are expected to be around 1.7 million tons. U.S. thermal volume is expected to be around 21 million tons.
CEO Insights
Peabody Energy CEO John Grech noted that global thermal coal prices stabilized and improved despite Columbia and South America supply disruptions. Robust demand continued from China, India and ASEAN countries. China also ended its "unofficial" ban on Australian coal imports, which boosted Australian import rates to more than 4 million tons per month. He commented, "Overall, near-turn demand for U.S. thermal coal is expected to be muted due to low gas prices and stronger renewable generation. However, as summer weather brings stronger total low demand and increased LNG export pressure gas prices, coal demand has the potential to increase in the second half of 2023.”
Peabody Energy analyst ratings and price targets are at MarketBeat.
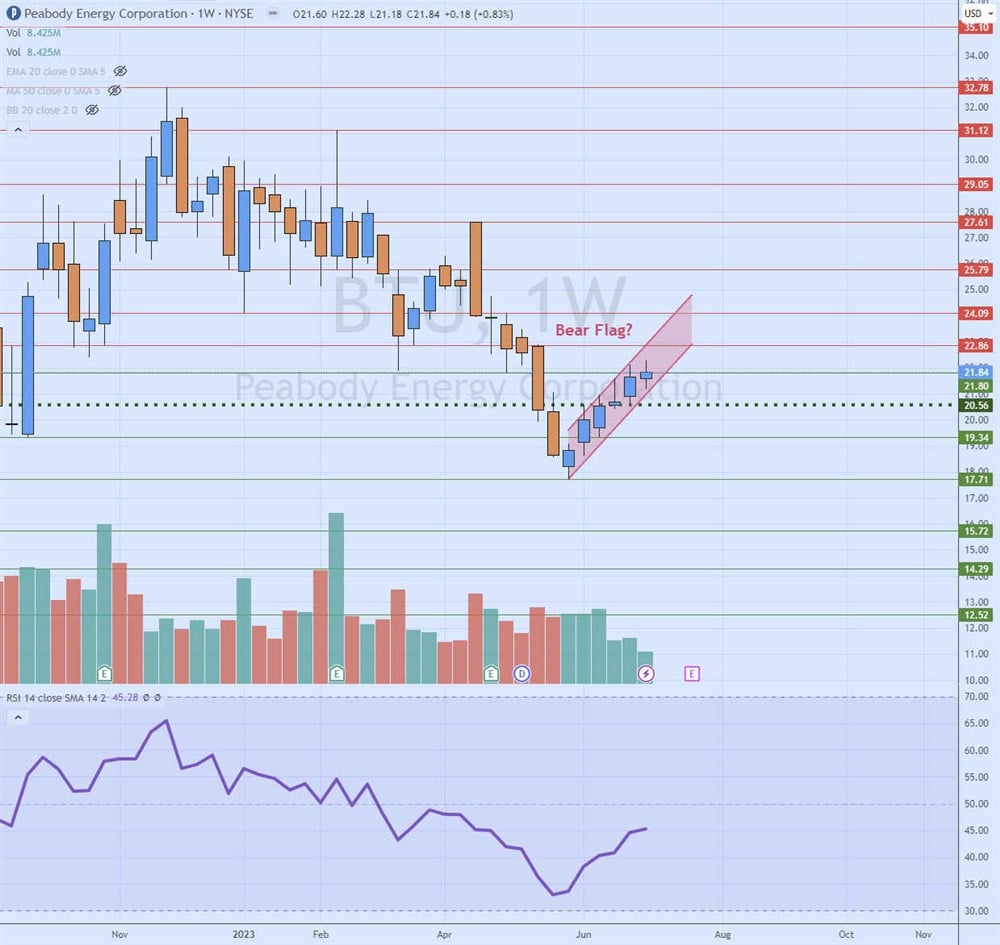
Weekly Bear Flag?
The weekly candlestick chart on BTU started to downtrend after peaking at $32.78 in November 2022, forming the flagpole base. BTU finally bottomed at $17.71 in May 2023. It formed a weekly market structure low (MSL) breakout through the $20.56 trigger resulting in five higher high candles.
The bounce was in a tight parallel channel resembling a flag after the flagpole formed. The weekly RSI also bounces under the 35-band, crossing through the 45-band. The bounce angle suggests that a bear flow may be forming if shares fall under the weekly MSL trigger area at $20.56. Pullback support levels are $20.56 weekly MSL trigger, $19.34, $17.71 swing low and $15.72.
