


The electric vehicle (EV) movement has become a secular tailwind driven by both global decarbonization initiatives, social awareness and government incentives. EV stocks have seen a boom and bust cycle in the past three years with EV stocks losing most of their value. EVs make up 7.2% of total U.S. car sales. Major automakers like General Motors Company (NYSE: GM), Ford Motors (NYSE: F) and Volkswagen AG (OTCMKTS: VWAGY) have committed huge resources to bolstering their EV offerings.
EV sales rose 36% in 2022 despite uncertain macroeconomic conditions, which suggests the EV movement is still hot. On the other hand, EV stocks continued to lose value in 2022, falling with the benchmark indexes and most into obscurity. Slumping EV sales towards the end of 2022 were recharged as lead EV manufacturer Tesla Inc. (NASDAQ: TSLA) implemented a series of price cuts on some of its models heading into 2023.
Government Subsidies
The Inflation Reduction Act provided tax incentives for qualifying EV purchases. The types of EVs that qualify for up to a $7,500 tax credit have been dwindling as conditions get adjusted with more adjustments expects in 2024. The goal to incentivize EV ownership by making it cheaper to buy has been successful. The question is whether that can continue when subsidies get phased out eventually. Some jurisdictions are going the other way. There’s a bill in Texas to implement a $200 annual EV tax. This is to supplement money the state would normally receive from its gas tax since EVs don’t use gas.
Gartner Hype Cycle Keeps on Turning
EVs are playing out like the Gartner Hype Cycle where the market goes into a frenzy shooting EV stocks to the moon on the potential and then eventually imploding as the reality gets adopted by the mainstream. This has been a constant theme with every secular trend, including solar energy, cell phones, the internet, search engines, cloud computing, 3D printing, mobility, social media, video streaming and currently, artificial intelligence (AI). What happens after the bust? Leaders start to emerge as their stocks get a second life. After the internet bubble of 2000, Amazon’s stock price fell from $300 to sub $15 before it recovered north of $3,000 pre-split. Most of the other internet companies disappeared.
Thrivers After the Bust Cycle
Stocks like First Solar Inc. (NASDAQ: FSLR), Amazon.com Inc. (NASDAQ: AMZN), Netflix Inc. (NASDAQ: NFLX) and Meta Platforms Inc. (NASDAQ: META) are just a few examples of the chosen ones, stocks that recovered after the smoke (and mirrors) cleared.
EV Stock Bust Cycle
With the exception of Tesla, most EV stocks are trading for a fraction of what they were just two years ago. The landscape is littered with EV stock bagholders who bought into the hype further soiled by the special purpose acquisition company (SPAC) frenzy on 2021. The remaining U.S. EV stocks that aren’t penny stocks now are still down huge. Lucid Group Inc. (NASDAQ: LCID), Rivian Automotive Inc. (NASDAQ: RIVN) and Fisker Inc. (NYSE: FSR) shares are down 80% to 90% from their highs just two years ago. Even Tesla shares have fallen just under (60%) off their highs as margins continue to fall. Telsa is still projected to grow sales 24% and has a 62.4% market share, down from 79% in 2020. Dozens of EV models are expected to come out by the end of 2024. The EV survivors and thrivers should become clearer by then.
TSLA Weekly Head and Shoulders Pattern
The weekly candlestick chart on TSLA illustrates a weekly head and shoulders breakdown. The formation started in January 2021 after making its first new high and left shoulder at $300.13 (split adjusted). TSLA fell to a low of $183.22 in May 2021 to start he neckline. TSLA staged a rally to new all-time highs forming the head at $414.50 in November 2021.
Shares fell to a higher low of $206.86 in May 2022 to connect the neckline. TSLA bounced to a swing high of $314.57 in August 2022 to form the right shoulders. TSLA sold off to retest the neckline around $220 through October 2022 but finally broke it by November 2022.
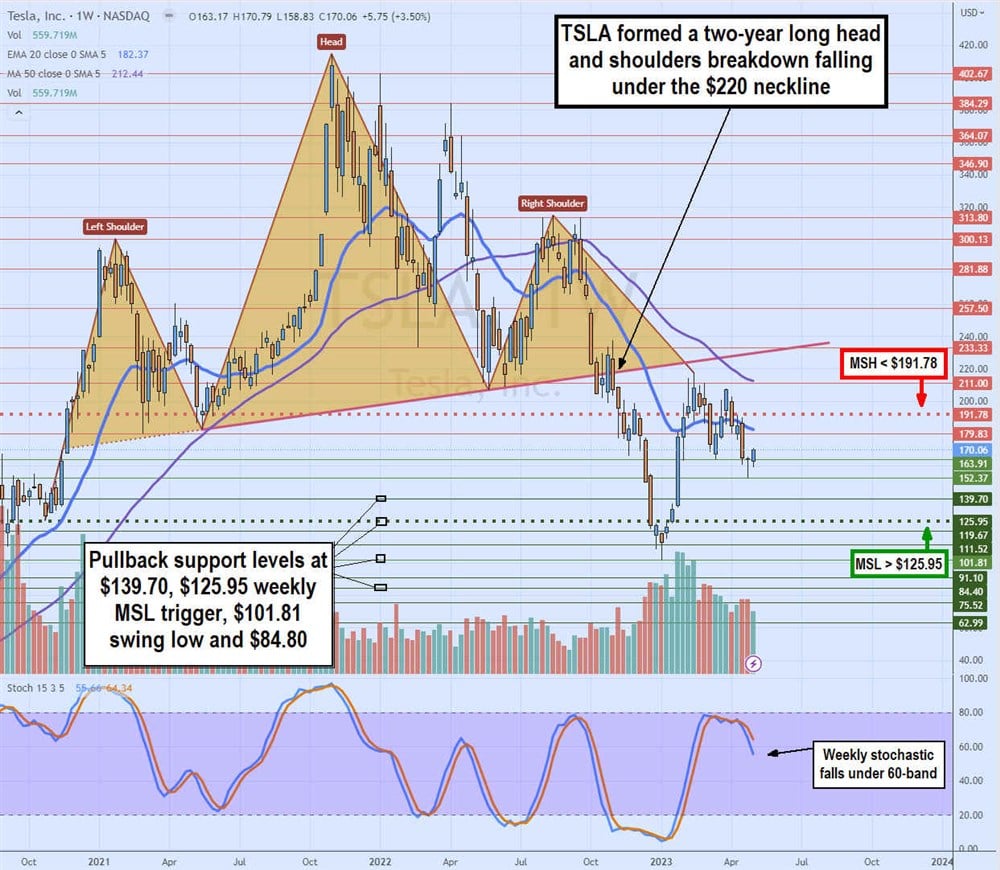
Shares continued to plunge to a new swing low of $101.81 in January 2023 before staging a rally on the weekly market structure low (MSL) buy trigger above $125.95. Shares rallied to a peak of $217.95 before triggering a weekly market structure high (MSH) sell trigger on the breakdown under $191.78.
The weekly stochastic peaked at the 80-band and is falling under the 60-band as shares continue to stay well under the neckline resistance at $228. Pullback supports are at $139.70, $125.95 weekly MSL trigger, $101.81 swing low and $84.80. Tesla analyst ratings and price targets can be found at MarketBeat.
