


Strong demand drives record TSS and APM performance, now targeting the high end of Adjusted EBITDA guidance range and increasing Free Cash Flow outlook
The Chemours Company (“Chemours”) (NYSE: CC), a global chemistry company with leading market positions in Titanium Technologies, Thermal & Specialized Solutions, and Advanced Performance Materials, today announces its financial results for the second quarter 2022.
This press release features multimedia. View the full release here: https://www.businesswire.com/news/home/20220728005938/en/
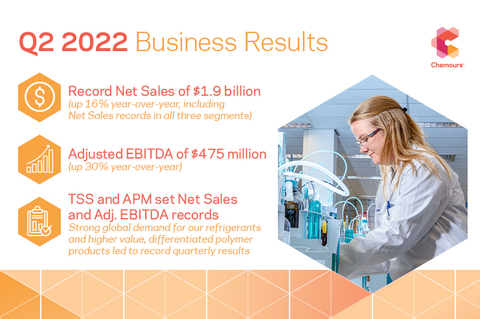
The Chemours Company reports robust Q2 2022 results. Strong demand drove record Thermal & Specialized Solutions (TSS) and Advanced Performance Materials (APM) performance. The company is now targeting the high end of its Adjusted EBITDA guidance range and increasing its Free Cash Flow outlook. (Graphic: Business Wire)
Second Quarter 2022 Results & Highlights
- Record Net Sales of $1.9 billion, up 16% year-over-year, including record Net Sales in all three segments
- Net Income of $201 million with EPS of $1.26, up $0.87 year-over-year
- Adjusted Net Income* of $302 million with Adjusted EPS* of $1.89, up $0.69 year-over-year
- Adjusted EBITDA* of $475 million, up 30% year-over-year
- Strong global demand for our refrigerants and higher value, differentiated polymer products led to record Adjusted EBITDA for both TSS and APM
- Free Cash Flow of $229 million, up 21% year-over-year
- Now targeting the high end of our full year Adjusted EBITDA guidance range of $1.475 billion to $1.575 billion and increasing our Free Cash Flow outlook to greater than $600 million
- Announced Corpus Christi, Texas plant expansion to support strong demand for low GWP Opteon™ refrigerants
- On July 27, 2022, the Company's Board of Directors approved a third quarter dividend of $0.25 per share, consistent with the prior quarter
“The second quarter’s results demonstrate the strength of our highly focused portfolio,” said Mark Newman, Chemours President and CEO. “We achieved record-setting performances in TSS and APM, and our results in these two segments are a testament to their long-term secular growth potential. In TT, we continued to meet customer commitments despite challenging logistics conditions, and I am proud of the team’s efforts to serve our customers despite being ore constrained. The long-term growth prospects and earnings quality of the company remain strong in the face of challenging global macroeconomic conditions.”
Second quarter 2022 Net Sales were $1.9 billion, 16% higher than the prior-year quarter. Price was a positive contributor to the improved results, up 23%, partially offset by volume headwinds of (1)% and currency headwinds of (2)%, on a year-over-year basis. Portfolio change, driven by the sale of our Mining Solutions business in 2021, was a (4)% headwind on a year-over-year basis.
Second quarter Net Income was $201 million, resulting in EPS of $1.26, inclusive of a $165 million charge associated with the legacy environmental remediation programs at our Fayetteville Works site. Adjusted Net Income was $302 million. Adjusted EPS was $1.89, up $0.69 vs. the prior-year quarter. Adjusted EBITDA for the second quarter of 2022 rose 30% to $475 million in comparison to $366 million in the prior-year second quarter, a result of higher pricing partially offset by raw material inflation and logistics challenges. Price vs. cost differential continued to be favorable in the second quarter. Currency was a (7)%, or $(27) million headwind vs. the prior-year quarter due to a stronger USD.
Titanium Technologies (TT)
Delivering high-quality Ti-Pure™ pigment through customer-centered innovation and sustainability leadership
In the second quarter, Titanium Technologies segment Net Sales were a record $968 million, up $109 million, or 13%, from $859 million in the prior-year quarter. Compared with the prior-year quarter, price increased by 23%, volume declined by (8)%, and currency was a (2)% headwind. Lower volumes reflect the impact of ore constraints, which affected our ability to maximize production across our circuit. Price increased by 6% sequentially, driven by all customer channels as demand for our Ti-Pure™ pigment remained strong. Volume was flat on a sequential basis reflecting ongoing ore constraints despite steady demand for our products across all end-markets and regions. Segment Adjusted EBITDA was $216 million, flat to the prior-year quarter, resulting in a segment Adjusted EBITDA Margin of 22%. Adjusted EBITDA remained largely unchanged as the impact of the aforementioned increase in price was largely offset by lower volumes and higher raw material, energy, and logistics costs.
Thermal & Specialized Solutions (TSS)
Driving innovation in low GWP thermal management solutions to support customer transitions to more sustainable products
The Thermal & Specialized Solutions segment delivered record-breaking second quarter financial results. Net Sales were $518 million, up $178 million, or 52%, from the prior-year quarter. Price contributed 39%, and volume increased 15%, while currency was a slight (2)% headwind. Prices increased in most markets across the business due to changing market and regulatory dynamics and measures taken to recover increases in the cost of raw materials. Volume increased due to the continued adoption of Opteon™ low GWP refrigerants and other specialized solutions. Price increased 1% and volume increased 21% on a sequential basis. Segment Adjusted EBITDA improved $98 million, or 85%, to $213 million vs. the prior-year quarter, driven by the aforementioned increase in price and favorable product mix, partially offset by higher raw material costs. Second quarter Adjusted EBITDA Margin of 41% reflects strong expansion from the prior-year quarter driven by favorable pricing and product mix. The company also announced an $80 million investment at our Corpus Christi, Texas plant to expand Opteon™ YF capacity to support the continued transition to lower GWP refrigerants. This capacity expansion, anticipated to be complete by the end of 2024, pending final permit approvals, and current de-bottlenecking projects, will increase our Opteon™ YF capacity by approximately 40%.
Advanced Performance Materials (APM)
Creating a clean energy and advanced electronics powerhouse
The Advanced Performance Materials segment delivered record-breaking financial results for the second consecutive quarter. Segment Net Sales were $401 million vs. $362 million in the prior-year quarter, an increase of 11%. Price contributed 15% to the stronger results, while volume and currency were headwinds of (1)% and (3)%, respectively. Global average selling price increased due to a larger proportion of sales in high-value end markets, such as advanced electronics, semiconductors, and clean energy, as well as customer-level price adjustments to offset rising raw material and energy costs. Modestly lower volumes were primarily a result of supply chain challenges and lower demand in non-strategic end markets consistent with our strategy to drive higher value, differentiated product offerings. Sequentially, price increased by 2%, and volume rose 4%, reflective of strong demand for our differentiated offerings, while currency was a headwind of (2)%. Adjusted EBITDA of $107 million was up $28 million, or 35%, from the prior year quarter, and Adjusted EBITDA Margin was 27% representing a 500 basis points improvement over the prior-year period due to strong operating leverage and price for our higher value products, partially offset by higher raw material and energy costs and growth investments.
Other Segment
The remaining Chemical Solutions business in Other Segment had Net Sales and Adjusted EBITDA in the second quarter 2022 of $28 million and $(2) million, respectively.
Corporate and Other Activities
Corporate and Other was an offset to second quarter Adjusted EBITDA of $(59) million vs. $(63) million in the prior-year quarter. The improvement over the prior year was driven by lower legacy legal costs and the recognition of qualified spend recovery as per the MOU agreement with DuPont and Corteva, partially offset by regulatory and environmental-related costs.
Liquidity
As of June 30, 2022, consolidated gross debt was $3.7 billion. Debt, net of $1.2 billion cash, was $2.5 billion, resulting in a net leverage ratio of approximately 1.6 times on a trailing twelve-month Adjusted EBITDA basis. Total liquidity was $2.0 billion, comprised of $1.2 billion cash, and $0.8 billion of revolving credit facility capacity, net of outstanding letters of credit.
Cash provided by operating activities for the second quarter of 2022 was $291 million vs. $256 million in the prior-year quarter. Capital expenditures for the second quarter of 2022 were $62 million vs. $67 million in the prior-year second quarter. Free Cash Flow for the second quarter of 2022 was $229 million vs. $189 million in the prior-year quarter. In the quarter, we repurchased $128 million of common stock, resulting in total share repurchases of $272 million through the first half of the year.
Outlook
Adjusted EBITDA for FY 2022 is now expected to be at the high end of the previously updated guidance range of $1.475 billion to $1.575 billion. We now expect Free Cash Flow to exceed $600 million vs. our previous guidance of greater than $550 million.
Mr. Newman concluded, “We now anticipate achieving the high end of our full year Adjusted EBITDA range and are raising our cash flow outlook to greater than $600 million as a result of our strong first half results. We are laser focused on delivering a strong 2022, while managing through increasingly uncertain macroeconomic conditions. As a management team, we are fully aligned on our four key strategic priorities – improving the earnings quality of TT, driving secular growth in TSS and APM, while managing and resolving legacy liabilities, and returning the majority of our Free Cash Flow to shareholders. We believe continuing to execute against these priorities is key to unlocking long term value for all our stakeholders.”
Conference Call
As previously announced, Chemours will hold a conference call and webcast exclusively for Q&A on July 29, 2022, at 8:30 AM Eastern Daylight Time. A transcript of the prepared remarks, the webcast, and additional presentation materials can be accessed by visiting the Events & Presentations page of Chemours' investor website, investors.chemours.com. A webcast replay of the conference call will be available on Chemours’ investor website.
About The Chemours Company
The Chemours Company (NYSE: CC) is a global leader in Titanium Technologies, Thermal & Specialized Solutions, and Advanced Performance Materials providing its customers with solutions in a wide range of industries with market-defining products, application expertise and chemistry-based innovations. We deliver customized solutions with a wide range of industrial and specialty chemicals products for markets, including coatings, plastics, refrigeration and air conditioning, transportation, semiconductor and consumer electronics, general industrial, and oil and gas. Our flagship products include prominent brands such as Ti-Pure™, Opteon™, Freon™, Teflon™, Viton™, Nafion™, and Krytox™. The company has approximately 6,400 employees and 29 manufacturing sites serving approximately 3,200 customers in approximately 120 countries. Chemours is headquartered in Wilmington, Delaware and is listed on the NYSE under the symbol CC.
For more information, we invite you to visit chemours.com or follow us on Twitter @Chemours or LinkedIn.
Non-GAAP Financial Measures
We prepare our financial statements in accordance with Generally Accepted Accounting Principles (GAAP). Within this press release, we may make reference to Adjusted Net Income, Adjusted EPS, Adjusted EBITDA, Adjusted EBITDA Margin, Free Cash Flow, Adjusted Effective Tax Rate, Return on Invested Capital and Net Leverage Ratio which are non-GAAP financial measures. The company includes these non-GAAP financial measures because management believes they are useful to investors in that they provide for greater transparency with respect to supplemental information used by management in its financial and operational decision making.
Management uses Adjusted Net Income, Adjusted EPS, Adjusted EBITDA, Adjusted EBITDA Margin, Free Cash Flow, Adjusted Effective Tax Rate, Return on Invested Capital and Net Leverage Ratio to evaluate the company's performance excluding the impact of certain noncash charges and other special items which we expect to be infrequent in occurrence in order to have comparable financial results to analyze changes in our underlying business from quarter to quarter.
Accordingly, the company believes the presentation of these non-GAAP financial measures, when used in conjunction with GAAP financial measures, is a useful financial analysis tool that can assist investors in assessing the company's operating performance and underlying prospects. This analysis should not be considered in isolation or as a substitute for analysis of our results as reported under GAAP. This analysis, as well as the other information in this press release, should be read in conjunction with the company's financial statements and footnotes contained in the documents that the company files with the U.S. Securities and Exchange Commission. The non-GAAP financial measures used by the company in this press release may be different from the methods used by other companies. For more information on the non-GAAP financial measures, please refer to the attached schedules or the table, "Reconciliation of GAAP Financial Measures to Non-GAAP Financial Measures" and materials posted to the company's website at investors.chemours.com.
Forward-Looking Statements
This press release contains forward-looking statements, within the meaning of Section 27A of the Securities Act of 1933 and Section 21E of the Securities Exchange Act of 1934, which involve risks and uncertainties. Forward-looking statements provide current expectations of future events based on certain assumptions and include any statement that does not directly relate to a historical or current fact. The words "believe," "expect," "will," "anticipate," "plan," "estimate," "target," "project" and similar expressions, among others, generally identify "forward-looking statements," which speak only as of the date such statements were made. These forward-looking statements may address, among other things, the outcome or resolution of any pending or future environmental liabilities, the commencement, outcome or resolution of any regulatory inquiry, investigation or proceeding, the initiation, outcome or settlement of any litigation, changes in environmental regulations in the U.S. or other jurisdictions that affect demand for or adoption of our products, anticipated future operating and financial performance for our segments individually and our company as a whole, business plans, prospects, targets, goals and commitments, capital investments and projects and target capital expenditures, plans for dividends or share repurchases, sufficiency or longevity of intellectual property protection, cost reductions or savings targets, plans to increase profitability and growth, our ability to make acquisitions, integrate acquired businesses or assets into our operations, and achieve anticipated synergies or cost savings, all of which are subject to substantial risks and uncertainties that could cause actual results to differ materially from those expressed or implied by such statements. Forward-looking statements are based on certain assumptions and expectations of future events that may not be accurate or realized. These statements are not guarantees of future performance. Forward-looking statements also involve risks and uncertainties that are beyond Chemours' control. In addition, the current COVID-19 pandemic has significantly impacted the national and global economy and commodity and financial markets, which has had and we expect will continue to have a negative impact on our financial results. The full extent and impact of the pandemic is still being determined and to date has included significant volatility in financial and commodity markets and a severe disruption in economic activity. The public and private sector response has led to travel restrictions, temporary business closures, quarantines, stock market volatility, and interruptions in consumer and commercial activity globally. Matters outside our control have affected our business and operations and may or may continue to hinder our ability to provide goods and services to customers, cause disruptions in our supply chains, adversely affect our business partners, significantly reduce the demand for our products, adversely affect the health and welfare of our personnel or cause other unpredictable events. Additionally, there may be other risks and uncertainties that Chemours is unable to identify at this time or that Chemours does not currently expect to have a material impact on its business. Factors that could cause or contribute to these differences include the risks, uncertainties and other factors discussed in our filings with the U.S. Securities and Exchange Commission, including in our Quarterly Report on Form 10-Q for the quarter ended June 30, 2022 and in our Annual Report on Form 10-K for the year ended December 31, 2021. Chemours assumes no obligation to revise or update any forward-looking statement for any reason, except as required by law.
* For information on our non-GAAP measures, please refer to the attached "Reconciliation of GAAP Financial Measures to non-GAAP Financial Measures (Unaudited)"
The Chemours Company Interim Consolidated Statements of Operations (Unaudited) (Dollars in millions, except per share amounts) |
||||||||||||||||
|
|
Three Months Ended June 30, |
|
|
Six Months Ended June 30, |
|
||||||||||
|
|
2022 |
|
|
2021 |
|
|
2022 |
|
|
2021 |
|
||||
Net sales |
|
$ |
1,915 |
|
|
$ |
1,655 |
|
|
$ |
3,679 |
|
|
$ |
3,091 |
|
Cost of goods sold |
|
|
1,418 |
|
|
|
1,391 |
|
|
|
2,697 |
|
|
|
2,530 |
|
Gross profit |
|
|
497 |
|
|
|
264 |
|
|
|
982 |
|
|
|
561 |
|
Selling, general, and administrative expense |
|
|
254 |
|
|
|
172 |
|
|
|
395 |
|
|
|
310 |
|
Research and development expense |
|
|
25 |
|
|
|
27 |
|
|
|
55 |
|
|
|
51 |
|
Restructuring, asset-related, and other charges |
|
|
1 |
|
|
|
5 |
|
|
|
12 |
|
|
|
— |
|
Total other operating expenses |
|
|
280 |
|
|
|
204 |
|
|
|
462 |
|
|
|
361 |
|
Equity in earnings of affiliates |
|
|
16 |
|
|
|
10 |
|
|
|
28 |
|
|
|
20 |
|
Interest expense, net |
|
|
(40 |
) |
|
|
(47 |
) |
|
|
(82 |
) |
|
|
(97 |
) |
Other income, net |
|
|
38 |
|
|
|
21 |
|
|
|
44 |
|
|
|
21 |
|
Income before income taxes |
|
|
231 |
|
|
|
44 |
|
|
|
510 |
|
|
|
144 |
|
Provision for (benefit from) income taxes |
|
|
30 |
|
|
|
(22 |
) |
|
|
76 |
|
|
|
(17 |
) |
Net income |
|
|
201 |
|
|
|
66 |
|
|
|
434 |
|
|
|
161 |
|
Net income attributable to Chemours |
|
$ |
201 |
|
|
$ |
66 |
|
|
$ |
434 |
|
|
$ |
161 |
|
Per share data |
|
|
|
|
|
|
|
|
|
|
|
|
|
|
|
|
Basic earnings per share of common stock |
|
$ |
1.29 |
|
|
$ |
0.40 |
|
|
$ |
2.75 |
|
|
$ |
0.97 |
|
Diluted earnings per share of common stock |
|
|
1.26 |
|
|
|
0.39 |
|
|
|
2.69 |
|
|
|
0.95 |
|
The Chemours Company Interim Consolidated Balance Sheets (Unaudited) (Dollars in millions, except per share amounts) |
||||||||
|
|
June 30, 2022 |
|
|
December 31, 2021 |
|
||
Assets |
|
|
|
|
|
|
|
|
Current assets: |
|
|
|
|
|
|
|
|
Cash and cash equivalents |
|
$ |
1,248 |
|
|
$ |
1,451 |
|
Accounts and notes receivable, net |
|
|
1,066 |
|
|
|
720 |
|
Inventories |
|
|
1,219 |
|
|
|
1,099 |
|
Prepaid expenses and other |
|
|
73 |
|
|
|
75 |
|
Total current assets |
|
|
3,606 |
|
|
|
3,345 |
|
Property, plant, and equipment |
|
|
9,264 |
|
|
|
9,232 |
|
Less: Accumulated depreciation |
|
|
(6,153 |
) |
|
|
(6,078 |
) |
Property, plant, and equipment, net |
|
|
3,111 |
|
|
|
3,154 |
|
Operating lease right-of-use assets |
|
|
220 |
|
|
|
227 |
|
Goodwill |
|
|
102 |
|
|
|
102 |
|
Other intangible assets, net |
|
|
13 |
|
|
|
6 |
|
Investments in affiliates |
|
|
177 |
|
|
|
169 |
|
Restricted cash and restricted cash equivalents |
|
|
100 |
|
|
|
100 |
|
Other assets |
|
|
401 |
|
|
|
447 |
|
Total assets |
|
$ |
7,730 |
|
|
$ |
7,550 |
|
Liabilities |
|
|
|
|
|
|
|
|
Current liabilities: |
|
|
|
|
|
|
|
|
Accounts payable |
|
$ |
1,249 |
|
|
$ |
1,162 |
|
Compensation and other employee-related cost |
|
|
111 |
|
|
|
173 |
|
Short-term and current maturities of long-term debt |
|
|
24 |
|
|
|
25 |
|
Current environmental remediation |
|
|
239 |
|
|
|
173 |
|
Other accrued liabilities |
|
|
263 |
|
|
|
325 |
|
Total current liabilities |
|
|
1,886 |
|
|
|
1,858 |
|
Long-term debt, net |
|
|
3,656 |
|
|
|
3,724 |
|
Operating lease liabilities |
|
|
178 |
|
|
|
179 |
|
Long-term environmental remediation |
|
|
468 |
|
|
|
389 |
|
Deferred income taxes |
|
|
54 |
|
|
|
49 |
|
Other liabilities |
|
|
273 |
|
|
|
269 |
|
Total liabilities |
|
|
6,515 |
|
|
|
6,468 |
|
Commitments and contingent liabilities |
|
|
|
|
|
|
|
|
Equity |
|
|
|
|
|
|
|
|
Common stock (par value $0.01 per share; 810,000,000 shares authorized; 194,761,628 shares issued and 155,572,669 shares outstanding at June 30, 2022; 191,860,159 shares issued and 161,046,732 shares outstanding at December 31, 2021) |
|
|
2 |
|
|
|
2 |
|
Treasury stock, at cost (39,188,959 shares at June 30, 2022; 30,813,427 shares at December 31, 2021) |
|
|
(1,517 |
) |
|
|
(1,247 |
) |
Additional paid-in capital |
|
|
1,005 |
|
|
|
944 |
|
Retained earnings |
|
|
2,102 |
|
|
|
1,746 |
|
Accumulated other comprehensive loss |
|
|
(378 |
) |
|
|
(364 |
) |
Total Chemours stockholders’ equity |
|
|
1,214 |
|
|
|
1,081 |
|
Non-controlling interests |
|
|
1 |
|
|
|
1 |
|
Total equity |
|
|
1,215 |
|
|
|
1,082 |
|
Total liabilities and equity |
|
$ |
7,730 |
|
|
$ |
7,550 |
|
The Chemours Company Interim Consolidated Statements of Cash Flows (Unaudited) (Dollars in millions) |
||||||||
|
|
Six Months Ended June 30, |
|
|||||
|
|
2022 |
|
|
2021 |
|
||
Cash flows from operating activities |
|
|
|
|
|
|
|
|
Net income |
|
$ |
434 |
|
|
$ |
161 |
|
Adjustments to reconcile net income to cash provided by operating activities: |
|
|
|
|
|
|
|
|
Depreciation and amortization |
|
|
146 |
|
|
|
163 |
|
Gain on sales of assets and businesses, net |
|
|
(27 |
) |
|
|
(2 |
) |
Equity in earnings of affiliates, net |
|
|
(23 |
) |
|
|
(19 |
) |
Amortization of debt issuance costs and issue discounts |
|
|
4 |
|
|
|
4 |
|
Deferred tax benefit |
|
|
(9 |
) |
|
|
(39 |
) |
Asset-related charges |
|
|
5 |
|
|
|
— |
|
Stock-based compensation expense |
|
|
17 |
|
|
|
20 |
|
Net periodic pension cost |
|
|
4 |
|
|
|
3 |
|
Defined benefit plan contributions |
|
|
(7 |
) |
|
|
(8 |
) |
Other operating charges and credits, net |
|
|
(8 |
) |
|
|
24 |
|
Decrease (increase) in operating assets: |
|
|
|
|
|
|
|
|
Accounts and notes receivable |
|
|
(339 |
) |
|
|
(288 |
) |
Inventories and other operating assets |
|
|
(86 |
) |
|
|
(60 |
) |
(Decrease) increase in operating liabilities: |
|
|
|
|
|
|
|
|
Accounts payable and other operating liabilities |
|
|
182 |
|
|
|
336 |
|
Cash provided by operating activities |
|
|
293 |
|
|
|
295 |
|
Cash flows from investing activities |
|
|
|
|
|
|
|
|
Purchases of property, plant, and equipment |
|
|
(168 |
) |
|
|
(127 |
) |
Proceeds from sales of assets and businesses |
|
|
33 |
|
|
|
— |
|
Foreign exchange contract settlements, net |
|
|
(1 |
) |
|
|
(7 |
) |
Other investing activities |
|
|
(9 |
) |
|
|
— |
|
Cash used for investing activities |
|
|
(145 |
) |
|
|
(134 |
) |
Cash flows from financing activities |
|
|
|
|
|
|
|
|
Debt repayments |
|
|
(7 |
) |
|
|
(27 |
) |
Payments on finance leases |
|
|
(6 |
) |
|
|
(5 |
) |
Payments of debt issuance cost |
|
|
(1 |
) |
|
|
— |
|
Purchases of treasury stock, at cost |
|
|
(272 |
) |
|
|
(13 |
) |
Proceeds from exercised stock options, net |
|
|
48 |
|
|
|
11 |
|
Payments related to tax withholdings on vested stock awards |
|
|
(4 |
) |
|
|
(2 |
) |
Payments of dividends to the Company's common shareholders |
|
|
(78 |
) |
|
|
(82 |
) |
Cash used for financing activities |
|
|
(320 |
) |
|
|
(118 |
) |
Effect of exchange rate changes on cash, cash equivalents, restricted cash and restricted cash equivalents |
|
|
(31 |
) |
|
|
(9 |
) |
(Decrease) increase in cash, cash equivalents, restricted cash and restricted cash equivalents |
|
|
(203 |
) |
|
|
34 |
|
Cash, cash equivalents, restricted cash, and restricted cash equivalents at January 1, |
|
|
1,551 |
|
|
|
1,105 |
|
Cash, cash equivalents, restricted cash and restricted cash equivalents at June 30, |
|
$ |
1,348 |
|
|
$ |
1,139 |
|
|
|
|
|
|
|
|
|
|
Supplemental cash flows information |
|
|
|
|
|
|
|
|
Non-cash investing and financing activities: |
|
|
|
|
|
|
|
|
Purchases of property, plant, and equipment included in accounts payable |
|
$ |
41 |
|
|
$ |
43 |
|
Treasury Stock repurchased, not settled |
|
|
2 |
|
|
|
2 |
|
The Chemours Company Segment Financial and Operating Data (Unaudited) (Dollars in millions) |
||||||||||||||||||||||||
Segment Net Sales |
|
|
|
|
|
|
|
|
|
|
|
|
|
|
|
Three Months |
|
|
|
|
|
|
||
|
|
|
|
|
|
|
Ended |
|
|
Sequential |
|
|||||||||||||
|
Three Months Ended June 30, |
|
|
Increase / |
|
|
March 31, |
|
|
Increase / |
|
|||||||||||||
|
2022 |
|
|
2021 |
|
|
(Decrease) |
|
|
2022 |
|
|
(Decrease) |
|
||||||||||
Titanium Technologies |
$ |
|
968 |
|
|
$ |
|
859 |
|
|
$ |
|
109 |
|
|
$ |
|
928 |
|
|
$ |
|
40 |
|
Thermal & Specialized Solutions |
|
|
518 |
|
|
|
|
340 |
|
|
|
|
178 |
|
|
|
|
425 |
|
|
|
|
93 |
|
Advanced Performance Materials |
|
|
401 |
|
|
|
|
362 |
|
|
|
|
39 |
|
|
|
|
385 |
|
|
|
|
16 |
|
Other Segment |
|
|
28 |
|
|
|
|
94 |
|
|
|
|
(66 |
) |
|
|
|
26 |
|
|
|
|
2 |
|
Total Net Sales |
$ |
|
1,915 |
|
|
$ |
|
1,655 |
|
|
$ |
|
260 |
|
|
$ |
|
1,764 |
|
|
$ |
|
151 |
|
Segment Adjusted EBITDA |
|
|
|
|
|
|
|
|
|
|
Three Months |
|
|
|
|
|
|
|||||||
|
|
|
|
|
|
|
|
|
|
|
|
|
|
|
|
Ended |
|
|
Sequential |
|
||||
|
Three Months Ended June 30, |
|
|
Increase / |
|
|
March 31, |
|
|
Increase / |
|
|||||||||||||
|
2022 |
|
|
2021 |
|
|
(Decrease) |
|
|
2022 |
|
|
(Decrease) |
|
||||||||||
Titanium Technologies |
$ |
|
216 |
|
|
$ |
|
217 |
|
|
$ |
|
(1 |
) |
|
$ |
|
206 |
|
|
$ |
|
10 |
|
Thermal & Specialized Solutions |
|
|
213 |
|
|
|
|
115 |
|
|
|
|
98 |
|
|
|
|
174 |
|
|
|
|
39 |
|
Advanced Performance Materials |
|
|
107 |
|
|
|
|
79 |
|
|
|
|
28 |
|
|
|
|
88 |
|
|
|
|
19 |
|
Other Segment |
|
|
(2 |
) |
|
|
|
18 |
|
|
|
|
(20 |
) |
|
|
|
— |
|
|
|
|
(2 |
) |
Corporate and Other |
|
|
(59 |
) |
|
|
|
(63 |
) |
|
|
|
4 |
|
|
|
|
(65 |
) |
|
|
|
6 |
|
Total Adjusted EBITDA |
$ |
|
475 |
|
|
$ |
|
366 |
|
|
$ |
|
109 |
|
|
$ |
|
403 |
|
|
$ |
|
72 |
|
|
|
|
|
|
|
|
|
|
|
|
|
|
|
|
|
|
|
|
|
|
|
|
|
|
Adjusted EBITDA Margin |
25% |
|
|
22% |
|
|
|
|
|
23% |
|
|
|
|
||||||||||
Quarterly Change in Net Sales from the three months ended June 30, 2021 |
|
|||||||||||||||||||
|
June 30, 2022 |
|
|
Percentage Change vs. |
|
Percentage Change Due To |
|
|||||||||||||
|
Net Sales |
|
|
June 30, 2021 |
|
Price |
|
Volume |
|
Currency |
|
Portfolio |
|
|||||||
Total Company |
$ |
|
1,915 |
|
|
|
16 |
% |
|
23 |
% |
|
(1 |
)% |
|
(2 |
)% |
|
(4 |
)% |
|
|
|
|
|
|
|
|
|
|
|
|
|
|
|
|
|
|
|
|
|
Titanium Technologies |
$ |
|
968 |
|
|
|
13 |
% |
|
23 |
% |
|
(8 |
)% |
|
(2 |
)% |
|
— |
% |
Thermal & Specialized Solutions |
|
|
518 |
|
|
|
52 |
% |
|
39 |
% |
|
15 |
% |
|
(2 |
)% |
|
— |
% |
Advanced Performance Materials |
|
|
401 |
|
|
|
11 |
% |
|
15 |
% |
|
(1 |
)% |
|
(3 |
)% |
|
— |
% |
Other Segment |
|
|
28 |
|
|
|
(70 |
)% |
|
3 |
% |
|
— |
% |
|
— |
% |
|
(73 |
)% |
Quarterly Change in Net Sales from the three months ended March 31, 2022 |
|
|||||||||||||||||||
|
June 30, 2022 |
|
|
Percentage Change vs. |
|
Percentage Change Due To |
|
|||||||||||||
|
Net Sales |
|
|
March 31, 2022 |
|
Price |
|
Volume |
|
Currency |
|
Portfolio |
|
|||||||
Total Company |
$ |
|
1,915 |
|
|
|
9 |
% |
|
4 |
% |
|
6 |
% |
|
(1 |
)% |
|
— |
% |
|
|
|
|
|
|
|
|
|
|
|
|
|
|
|
|
|
|
|
|
|
Titanium Technologies |
$ |
|
968 |
|
|
|
4 |
% |
|
6 |
% |
|
— |
% |
|
(2 |
)% |
|
— |
% |
Thermal & Specialized Solutions |
|
|
518 |
|
|
|
22 |
% |
|
1 |
% |
|
21 |
% |
|
— |
% |
|
— |
% |
Advanced Performance Materials |
|
|
401 |
|
|
|
4 |
% |
|
2 |
% |
|
4 |
% |
|
(2 |
)% |
|
— |
% |
Other Segment |
|
|
28 |
|
|
|
8 |
% |
|
5 |
% |
|
3 |
% |
|
— |
% |
|
— |
% |
The Chemours Company
Reconciliation of GAAP Financial Measures to Non-GAAP Financial Measures (Unaudited)
(Dollars in millions)
GAAP Net Income Attributable to Chemours to Adjusted Net Income and Adjusted EBITDA Reconciliation
Adjusted earnings before interest, taxes, depreciation, and amortization (“Adjusted EBITDA”) is defined as income (loss) before income taxes, excluding the following items: interest expense, depreciation, and amortization; non-operating pension and other post-retirement employee benefit costs, which represents the components of net periodic pension (income) costs excluding the service cost component; exchange (gains) losses included in other income (expense), net; restructuring, asset-related, and other charges; (gains) losses on sales of businesses or assets; and, other items not considered indicative of the Company’s ongoing operational performance and expected to occur infrequently, including Qualified Spend reimbursable by DuPont and/or Corteva as part of the Company's cost-sharing agreement under the terms of the MOU that were previously excluded from Adjusted EBITDA. Adjusted Net Income is defined as net income (loss) attributable to Chemours, adjusted for items excluded from Adjusted EBITDA, except interest expense, depreciation, amortization, and certain provision for (benefit from) income tax amounts.
|
|
Three Months Ended |
|
|
Six Months Ended |
|
|||||||||||||||||||
|
|
June 30, |
|
|
March 31, |
|
|
June 30, |
|
||||||||||||||||
|
|
2022 |
|
|
2021 |
|
|
2022 |
|
|
2022 |
|
|
2021 |
|
||||||||||
Net income attributable to Chemours |
|
$ |
|
201 |
|
|
$ |
|
66 |
|
|
$ |
|
234 |
|
|
$ |
|
434 |
|
|
$ |
|
161 |
|
Non-operating pension and other post-retirement employee benefit income |
|
|
|
(2 |
) |
|
|
|
(2 |
) |
|
|
|
(1 |
) |
|
|
|
(3 |
) |
|
|
|
(5 |
) |
Exchange losses (gains), net |
|
|
|
3 |
|
|
|
|
(3 |
) |
|
|
|
— |
|
|
|
|
3 |
|
|
|
|
5 |
|
Restructuring, asset-related, and other charges (1) |
|
|
|
— |
|
|
|
|
5 |
|
|
|
|
16 |
|
|
|
|
16 |
|
|
|
|
— |
|
Gain on sales of assets and businesses, net (2) |
|
|
|
(26 |
) |
|
|
|
(2 |
) |
|
|
|
(1 |
) |
|
|
|
(27 |
) |
|
|
|
(2 |
) |
Natural disasters and catastrophic events (3) |
|
|
|
— |
|
|
|
|
3 |
|
|
|
|
— |
|
|
|
|
— |
|
|
|
|
19 |
|
Transaction costs |
|
|
|
— |
|
|
|
|
— |
|
|
|
|
— |
|
|
|
|
— |
|
|
|
|
5 |
|
Qualified spend recovery (4) |
|
|
|
(13 |
) |
|
|
|
— |
|
|
|
|
(14 |
) |
|
|
|
(27 |
) |
|
|
|
— |
|
Legal and environmental charges (5,6) |
|
|
|
170 |
|
|
|
|
195 |
|
|
|
|
8 |
|
|
|
|
178 |
|
|
|
|
208 |
|
Adjustments made to income taxes (7) |
|
|
|
(2) |
|
|
|
(10 |
) |
|
|
|
(3 |
) |
|
|
|
(6) |
|
|
|
(10 |
) |
||
Benefit from income taxes relating to reconciling items (8) |
|
|
|
(29) |
|
|
|
(47 |
) |
|
|
|
— |
|
|
|
|
(28) |
|
|
|
(58 |
) |
||
Adjusted Net Income (9) |
|
|
|
302 |
|
|
|
|
205 |
|
|
|
|
239 |
|
|
|
|
540 |
|
|
|
|
323 |
|
Interest expense, net |
|
|
|
40 |
|
|
|
|
47 |
|
|
|
|
41 |
|
|
|
|
82 |
|
|
|
|
97 |
|
Depreciation and amortization |
|
|
|
72 |
|
|
|
|
79 |
|
|
|
|
74 |
|
|
|
|
146 |
|
|
|
|
163 |
|
All remaining provision for income taxes (9) |
|
|
|
61 |
|
|
|
|
35 |
|
|
|
|
49 |
|
|
|
|
110 |
|
|
|
|
51 |
|
Adjusted EBITDA |
|
$ |
|
475 |
|
|
$ |
|
366 |
|
|
$ |
|
403 |
|
|
$ |
|
878 |
|
|
$ |
|
634 |
|
|
|
|
|
|
|
|
|
|
|
|
|
|
|
|
|
|
|
|
|
|
|
|
|
|
|
Adjusted effective tax rate (9) |
|
|
|
17 |
% |
|
|
|
15 |
% |
|
|
|
17 |
% |
|
|
|
17 |
% |
|
|
|
14 |
% |
(1) |
In 2022, restructuring, asset related, and other charges primarily includes asset charges and write-offs resulting from the conflict between Russia and Ukraine and our decision to suspend our business with Russian entities. In 2021, restructuring, asset-related, and other charges primarily includes a net $9 gain resulting from contract terminations with third-party services provider at our previously owned Mining Solutions facility in Gomez Palacio, Durango, Mexico. | ||
(2) |
Refer to “Note 6 – Other Income (Expense), Net” to the Interim Consolidated Financial Statements in our Quarterly Report on Form 10-Q for the quarter ended June 30, 2022 for further details. | ||
(3) |
In 2021, natural disasters and catastrophic events pertains to the total cost of plant repairs and utility charges in excess of historical averages caused by Winter Storm Uri. | ||
(4) |
Qualified spend recovery represents costs and expenses that were previously excluded from Adjusted EBITDA, reimbursable by DuPont and/or Corteva as part of our cost-sharing agreement under the terms of the MOU which is discussed in further detail in "Note 16 – Commitments and Contingent Liabilities" to the Interim Consolidated Financial Statements in our Quarterly Report on Form 10-Q for the quarter ended June 30, 2022. | ||
(5) |
Legal charges pertains to litigation settlements, PFOA drinking water treatment accruals, and other legal charges. For the three and six months ended June 30, 2021, legal charges include $25 associated with our portion of the costs to enter into a Settlement Agreement, Limited Release, Waiver and Covenant Not to Sue reflecting Chemours, DuPont, Corteva, EID and the State of Delaware’s agreement to settle and fully resolve claims alleged against the companies. See “Note 16 – Commitments and Contingent Liabilities” to the Interim Consolidated Financial Statements in our Quarterly Report on Form 10-Q for the quarter ended June 30, 2022. | ||
(6) |
Environmental charges pertains to management’s assessment of estimated liabilities associated with certain non-recurring environmental remediation expenses at various sites. In 2022, environmental charges include $165 primarily related to an update to the off-site drinking water programs at Fayetteville and changes in estimates related to the barrier wall constructions. In 2021, environmental charges include $169 primarily related to the construction of the barrier wall, operation of the groundwater extraction and treatment system, and long-term enhancements to the old outfall treatment system. See “Note 16 – Commitments and Contingent Liabilities” to the Interim Consolidated Financial Statements in our Quarterly Report on Form 10-Q for the quarter ended June 30, 2022 for further details. | ||
(7) |
Includes the removal of certain discrete income tax impacts within our provision for income taxes, such as shortfalls and windfalls on our share-based payments, certain return-to-accrual adjustments, valuation allowance adjustments, unrealized gains and losses on foreign exchange rate changes, and other discrete income tax items. | ||
(8) |
The income tax impacts included in this caption are determined using the applicable rates in the taxing jurisdictions in which income or expense occurred for each of the reconciling items and represents both current and deferred income tax expense or benefit based on the nature of the non-GAAP financial measure. | ||
(9) |
Adjusted effective tax rate is defined as all remaining provision for income taxes divided by pre-tax Adjusted Net Income. |
The Chemours Company
Reconciliation of GAAP Financial Measures to Non-GAAP Financial Measures (Unaudited)
(Dollars in millions, except per share amounts)
GAAP Earnings per Share to Adjusted Earnings per Share Reconciliation
Adjusted earnings per share (“EPS”) is calculated by dividing Adjusted Net Income by the weighted-average number of common shares outstanding. Diluted Adjusted EPS accounts for the dilutive impact of stock-based compensation awards, which includes unvested restricted shares. Diluted Adjusted EPS considers the impact of potentially-dilutive securities, except in periods in which there is a loss because the inclusion of the potentially-dilutive securities would have an anti-dilutive effect.
|
|
Three Months Ended |
|
|
Six Months Ended |
|
|||||||||||||||||||
|
|
June 30, |
|
|
March 31, |
|
|
June 30, |
|
||||||||||||||||
|
|
2022 |
|
|
2021 |
|
|
2022 |
|
|
2022 |
|
|
2021 |
|
||||||||||
Numerator: |
|
|
|
|
|
|
|
|
|
|
|
|
|
|
|
||||||||||
Net income attributable to Chemours |
|
$ |
|
201 |
|
|
$ |
|
66 |
|
|
$ |
|
234 |
|
|
$ |
|
434 |
|
|
$ |
|
161 |
|
Adjusted Net Income |
|
|
|
302 |
|
|
|
|
205 |
|
|
|
|
239 |
|
|
|
|
540 |
|
|
|
|
323 |
|
Denominator: |
|
|
|
|
|
|
|
|
|
|
|
|
|
|
|
||||||||||
Weighted-average number of common shares outstanding - basic |
|
|
|
156,224,802 |
|
|
|
|
166,168,550 |
|
|
|
|
159,897,673 |
|
|
|
|
158,051,092 |
|
|
|
|
165,912,089 |
|
Dilutive effect of the Company's employee compensation plans |
|
|
|
3,442,411 |
|
|
|
|
3,989,453 |
|
|
|
|
3,681,907 |
|
|
|
|
3,562,159 |
|
|
|
|
3,693,498 |
|
Weighted-average number of common shares outstanding - diluted |
|
|
|
159,667,213 |
|
|
|
|
170,158,003 |
|
|
|
|
163,579,580 |
|
|
|
|
161,613,251 |
|
|
|
|
169,605,587 |
|
|
|
|
|
|
|
|
|
|
|
|
|
|
|
|
|
||||||||||
Basic earnings per share of common stock |
|
$ |
|
1.29 |
|
|
$ |
|
0.40 |
|
|
$ |
|
1.46 |
|
|
$ |
|
2.75 |
|
|
$ |
|
0.97 |
|
Diluted earnings per share of common stock |
|
|
|
1.26 |
|
|
|
|
0.39 |
|
|
|
|
1.43 |
|
|
|
|
2.69 |
|
|
|
|
0.95 |
|
Adjusted basic earnings per share of common stock |
|
|
|
1.93 |
|
|
|
|
1.23 |
|
|
|
|
1.49 |
|
|
|
|
3.42 |
|
|
|
|
1.95 |
|
Adjusted diluted earnings per share of common stock |
|
|
|
1.89 |
|
|
|
|
1.20 |
|
|
|
|
1.46 |
|
|
|
|
3.34 |
|
|
|
|
1.90 |
|
The Chemours Company
Reconciliation of GAAP Financial Measures to Non-GAAP Financial Measures (Unaudited)
(In millions, except per share amounts)
2022 Estimated GAAP Net Income Attributable to Chemours to Estimated Adjusted Net Income, Estimated Adjusted EBITDA and Estimated Adjusted EPS Reconciliation (*)
|
|
(Estimated)
|
|
|||||
|
|
Low |
|
|
High |
|
||
Net income attributable to Chemours |
|
$ |
712 |
|
|
$ |
792 |
|
Restructuring, transaction, and other costs, net (1) |
|
|
103 |
|
|
|
103 |
|
Adjusted Net Income |
|
|
815 |
|
|
|
895 |
|
Interest expense, net |
|
|
170 |
|
|
|
170 |
|
Depreciation and amortization |
|
|
300 |
|
|
|
300 |
|
All remaining provision for income taxes |
|
|
190 |
|
|
|
210 |
|
Adjusted EBITDA |
|
$ |
1,475 |
|
|
$ |
1,575 |
|
|
|
|
|
|
|
|
|
|
Weighted-average number of common shares outstanding - basic (2) |
|
|
156.6 |
|
|
|
156.6 |
|
Dilutive effect of the Company's employee compensation plans (3) |
|
|
3.5 |
|
|
|
3.5 |
|
Weighted-average number of common shares outstanding - diluted |
|
|
160.1 |
|
|
|
160.1 |
|
|
|
|
|
|
|
|
|
|
Basic earnings per share of common stock |
|
$ |
4.55 |
|
|
$ |
5.06 |
|
Diluted earnings per share of common stock (4) |
|
|
4.45 |
|
|
|
4.95 |
|
Adjusted basic earnings per share of common stock |
|
|
5.20 |
|
|
|
5.72 |
|
Adjusted diluted earnings per share of common stock (4) |
|
|
5.09 |
|
|
|
5.59 |
|
(1) |
Restructuring, transaction, and other costs, net includes the net provision for (benefit from) income taxes relating to reconciling items and adjustments made to income taxes for the removal of certain discrete income tax impacts. | ||
(2) |
The Company’s estimates for the weighted-average number of common shares outstanding - basic reflect results for the six months ended June 30, 2022, which are carried forward for the projection period. | ||
(3) |
The Company’s estimates for the dilutive effect of the Company’s employee compensation plans reflect the dilutive effect for the six months ended June 30, 2022, which is carried forward for the projection period. | ||
(4) |
Diluted earnings per share is calculated using net income available to common shareholders divided by diluted weighted-average common shares outstanding during each period, which includes unvested restricted shares. Diluted earnings per share considers the impact of potentially dilutive securities except in periods in which there is a loss because the inclusion of the potential common shares would have an anti-dilutive effect. | ||
| (*) | The Company’s estimates reflect its current visibility and expectations based on market factors, such as currency movements, macro-economic factors, and end-market demand. Actual results could differ materially from these current estimates. |
The Chemours Company
Reconciliation of GAAP Financial Measures to Non-GAAP Financial Measures (Unaudited)
(Dollars in millions)
GAAP Cash Flow Provided by Operating Activities to Free Cash Flows Reconciliation
Free Cash Flows is defined as cash flows provided by (used for) operating activities, less purchases of property, plant, and equipment as shown in the consolidated statements of cash flows.
|
|
Three Months Ended |
|
|
Six Months Ended |
|
|||||||||||||||||||
|
|
June 30, |
|
|
March 31, |
|
|
June 30, |
|
||||||||||||||||
|
|
2022 |
|
|
2021 |
|
|
2022 |
|
|
2022 |
|
|
2021 |
|
||||||||||
Cash provided by operating activities |
|
$ |
|
291 |
|
|
$ |
|
256 |
|
|
$ |
|
2 |
|
|
$ |
|
293 |
|
|
$ |
|
295 |
|
Less: Purchases of property, plant, and equipment |
|
|
|
(62 |
) |
|
|
|
(67 |
) |
|
|
|
(106 |
) |
|
|
|
(168 |
) |
|
|
|
(127 |
) |
Free Cash Flows |
|
$ |
|
229 |
|
|
$ |
|
189 |
|
|
$ |
|
(104 |
) |
|
$ |
|
125 |
|
|
$ |
|
168 |
|
2022 Estimated GAAP Cash Flow Provided by Operating Activities to Estimated Free Cash Flow Reconciliation (*)
|
|
(Estimated) |
|
|
|
Year Ended December 31, 2022 |
|
Cash flow provided by operating activities |
|
$ |
>1,000 |
Less: Purchases of property, plant, and equipment |
|
|
~(400) |
Free Cash Flows |
|
$ |
>600 |
(*) |
|
The Company’s estimates reflect its current visibility and expectations based on market factors, such as currency movements, macro-economic factors, and end-market demand. Actual results could differ materially from these current estimates. |
Return on Invested Capital Reconciliation
Return on Invested Capital (“ROIC”) is defined as Adjusted EBITDA, less depreciation and amortization (“Adjusted EBIT”), divided by the average of invested capital, which amounts to net debt, or debt less cash and cash equivalents, plus equity.
|
|
Twelve Months Ended June 30, |
|
|||||
|
|
2022 |
|
|
2021 |
|
||
Adjusted EBITDA (1) |
|
$ |
1,557 |
|
|
$ |
1,090 |
|
Less: Depreciation and amortization |
|
|
(300 |
) |
|
|
(321 |
) |
Adjusted EBIT |
|
$ |
1,257 |
|
|
$ |
769 |
|
|
|
|
|
|
|
|
|
|
|
|
As of June 30, |
|
|||||
|
|
2022 |
|
|
2021 |
|
||
Total debt, net (2) |
|
$ |
3,680 |
|
|
$ |
3,989 |
|
Total equity |
|
|
1,215 |
|
|
|
900 |
|
Less: Cash and cash equivalents |
|
|
(1,248 |
) |
|
|
(1,139 |
) |
Invested capital, net |
|
$ |
3,647 |
|
|
$ |
3,750 |
|
Average invested capital (3) |
|
$ |
3,667 |
|
|
$ |
3,834 |
|
|
|
|
|
|
|
|
|
|
Return on Invested Capital |
|
|
34 |
% |
|
|
20 |
% |
(1) |
Reconciliations of net income (loss) attributable to Chemours to Adjusted EBITDA are provided on a quarterly basis. See the preceding table for the reconciliation of net income (loss) attributable to Chemours to Adjusted EBITDA. | ||
(2) |
Total debt principal minus unamortized issue discounts of $5 and $6 and debt issuance costs of $25 and $25 at June 30, 2022 and 2021, respectively. | ||
(3) |
Average invested capital is based on a five-quarter trailing average of invested capital, net. |
The Chemours Company
Reconciliation of GAAP Financial Measures to Non-GAAP Financial Measures (Unaudited)
(Dollars in millions)
Net Leverage Ratio Reconciliation
Net Leverage Ratio is defined as our total debt principal, net, or our total debt principal outstanding less cash and cash equivalents, divided by Adjusted EBITDA.
|
|
As of June 30, |
|
|||||
|
|
2022 |
|
|
2021 |
|
||
Total debt principal |
|
$ |
3,710 |
|
|
$ |
4,020 |
|
Less: Cash and cash equivalents |
|
|
(1,248 |
) |
|
|
(1,139 |
) |
Total debt principal, net |
|
$ |
2,462 |
|
|
$ |
2,881 |
|
|
|
|
|
|
|
|
|
|
|
|
Twelve Months Ended June 30, |
|
|||||
|
|
2022 |
|
|
2021 |
|
||
Adjusted EBITDA (1) |
|
$ |
1,557 |
|
|
$ |
1,090 |
|
|
|
|
|
|
|
|
|
|
Net Leverage Ratio |
|
1.6x |
|
|
2.6x |
|
||
(1) |
|
Reconciliations of net income (loss) attributable to Chemours to Adjusted EBITDA are provided on a quarterly basis. See the preceding table for the reconciliation of net income (loss) attributable to Chemours to Adjusted EBITDA. |
View source version on businesswire.com: https://www.businesswire.com/news/home/20220728005938/en/
Contacts
INVESTORS
Jonathan Lock
SVP, Chief Development Officer
+1.302.773.2263
investor@chemours.com
Kurt Bonner
Manager, Investor Relations
+1.302.773.0026
investor@chemours.com
NEWS MEDIA
Cassie Olszewski
Media Relations and Financial Communications Manager
+1.302.219.7140
media@chemours.com
