


Fastly, Inc. (NYSE: FSLY), a global edge cloud platform, today announced observed traffic patterns on the internet between January and March 2020. The analysis delves into regional trends for key U.S. states and countries around the globe that are some of the most impacted by the COVID-19 pandemic (as of the end of March 2020), as well as activity within industries including gaming, streaming, digital publishing, social media, and edtech. Fastly concludes that internet quality challenges are largely related to regional policy enactments such as school closures and stay-at-home orders. Most industries are seeing upward traffic trends, with the digital publishing sector seeing the highest activity increases of industries analyzed.
This press release features multimedia. View the full release here: https://www.businesswire.com/news/home/20200408005584/en/
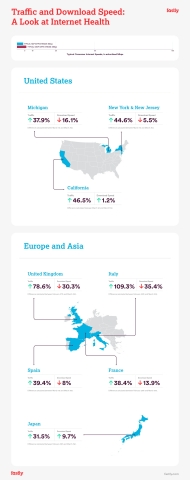
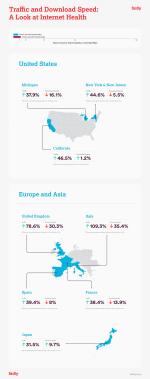
Traffic and Download Speed: A Look at Internet Health (Graphic: Business Wire)
“Overall, the internet is in good health,” said Fastly’s Chief Architect and Founder, Artur Bergman. “This is partly due to the regionality of these trends, but modern websites and applications are also better able to adapt to changing internet conditions. We are seeing the internet bring people together, whether for work, entertainment, or to get in touch with family and friends. And while there’s more traffic than in previous months, the internet is resilient.”
Internet Quality Challenges Correlate with Regional Policy Changes
To understand internet quality in impacted regions around the globe, Fastly used two key metrics: changes in the traffic volume served to those regions as a reflection of changes in internet use, and changes in download speed measured at their servers as a reflection of internet quality. Fastly’s analysis shows regions heavily impacted by the pandemic are seeing traffic volume go up, often strongly aligned with public policy announcements and enactments about school closures and lockdowns. Download speeds trend down as people become homebound with school closures and shelter-in-place or lockdowns taking effect. The quality decreases that Fastly observed happened outside of its networks and interconnects, and seemed to be strongly correlated with regional policy and population shifts, implying that internet quality is unlikely to degrade much further for regions that are already under stay-at-home orders.
Fastly has evaluated the countries of France, Italy, Japan, Spain, and the UK. Because policy shifts in the U.S. are taking place at the state level, Fastly investigated trends in the U.S. for four of the hardest hit U.S. states by COVID-19: California, Michigan, and New York and New Jersey. Fastly observed the following impacts to geographic traffic:
- One-month traffic trends: Over one month, from respective traffic baselines1, all regions analyzed reported increases in traffic with decreases in download speed, with the exceptions of Japan and California.
- Most notably, Italy saw a 109.3% increase in traffic, with a 35.4% decrease in download speed.
- Japan observed a 31.5% increase in traffic, but, markedly differentiated from other analyzed countries experiencing the impacts of COVID-19’s pandemic in their communities, it saw a 9.7% increase in download speed. Japan’s internet infrastructure seems to have absorbed this increased traffic.
- In the U.S., New York and New Jersey saw a 44.6% increase in traffic, but were able to weather it with a relatively modest 5.5% decrease in download speed.
- California saw a 46.5% increase in traffic, with a 1.2% increase in download speed. Similar to Japan, California’s internet infrastructure appears to have absorbed this increased traffic.
- School closures and regional stay-at-home orders: In France, Fastly observed a 45.4% increase in traffic shortly after its government announced school closures on March 12. This increase in traffic did not show a noticeable reduction in download speed, but on March 17, when schools closed and the national lockdown went into effect, download speed decreased by 20.6%. In Italy, traffic increased by 47% around February 19, after public information about lockdowns of various parts of Northern Italy began. After school closures go into effect on February 24, download speeds fall by about 9.2% between February 18 and February 24. In Japan, traffic jumps by 38% and speed decreases by 9.2% between February 25 and February 29, when school closure announcements began. School closures in Spain on March 12 mark the beginning of traffic increases of 26.2%, while there is no speed reduction.
- User experience: Across European nations, major streaming and VOD providers announced they would reduce the default bitrates of their video streams around March 19 in order to prevent the internet from acute strain. When analyzing traffic and download speed in France, Italy, and Spain, the reductions do not seem to have led to significant improvements in internet quality, but they may have helped keep it from deteriorating further. Additionally, beyond Europe, people who have had lower speed internet connections before coronavirus-related developments may currently be suffering from greater degradation than those who had higher speed broadband connections. Someone with a high-quality, 100Mbps internet connection might not even notice a download speed reduction of 35% — a typical 1080P video stream requires just 6Mbps and fits well within the resulting 65Mbps download speed. However someone with a lower-quality connection to the internet, such as 10Mbps, is likely to notice this quality degradation: their typical 1080P movie might now automatically adjust down to 720P to fit within the resulting 6.5Mbps.
From these findings, we learn that speed decreases may be more aligned with population shifts toward more internet use from homes, rather than with a traffic increase alone. In general, most regions saw their download speeds stabilize once school closures and lockdowns were fully enacted, when most of the population became homebound. For most regions, this happened mid-to-late March.
Increased Activity in Informational and Entertainment Verticals
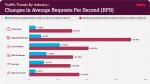
Fastly also analyzed industry-specific internet activity by comparing average requests per second (RPS), week-over-week, between two sets of dates: January 6, 2020, and February 16, 2020; and February 16, 2020, to March 29, 2020. The first set of dates represent what Fastly considers to be activity attributed to organic growth, as mainstream attention on the pandemic had not yet picked up to its current pace. The second set of dates occur during a much more dynamic era of coronavirus-related developments, and was instructive in helping understand how human behavior may be shifting in response to COVID-19.
During those time frames for each of the below verticals, Fastly observed the following traffic patterns:
- Streaming: From February 16 to March 29, streaming observed an increase in average RPS week-over-week by 29.6%. Similarly to gaming, this notable increase could reflect increased interest in streaming media content during lockdowns and social distancing.
- News and digital publishing: Of all verticals analyzed, these brands saw the biggest increase in average RPS week-over-week from February 16 to March 29 at 70.16%. The elevated activity may correlate to increasing newsroom attention on COVID-19-related content as the first quarter of the year progressed.
- Social Media: Social media platforms saw a 40.88% increase in average RPS week-over-week from February 16 to March 29. The greater increases in activity might represent a window into one way people are remaining connected with each other on various social media platforms.
- GIFs/memes: Brands that help end users create and share things like memes and GIFs observed a 30.28% increase in average RPS week-over-week from February 16 to March 29. The unusually high increase in activity may indicate that, in reaction to disruptions to daily life, some consumers have turned to humor to get through difficult times and connect with others.
- Gaming: From February 16 to March 29, gaming observed an increase in average RPS week-over-week by 28.54%. This could indicate that people are playing more virtual and online games as many communities look for ways to stay engaged while sheltering in place.
- EdTech: From February 16 to March 29, edtech observed a noticeably sharp increase in average RPS week-over-week by 34.55%. This could indicate that edtech platforms are indeed growing their usage as more school-age children are educated from home.
Check out the Fastly blog that explores an in-depth view of this data and other findings. For more information about how Fastly accommodates increases in internet activity around the globe, read another recent post, “Capacity planning and network expansion in a remote-first world.”
Methodology and Sources
For analysis of regional traffic, Fastly used the following metrics, which were gathered from sampled TCP connection stats (tcp_info) at connection close time as part of Fastly’s fleet-wide performance monitoring infrastructure:
- Traffic represents the average number of data bytes per day that were delivered to various geographies from all of our servers (acked_bytes field in tcp_info).
- Download speed represents the delivery rate reported by TCP over all connections from a region, averaged over a day (delivery_rate field in tcp_info). While the reported values are averages, various percentiles for download speeds all show similar trends and ratios to the average.
For global analysis of verticals, Fastly measured average requests per second (RPS) recorded at all our servers. RPS is a count of requests received at our serves from end users every second.
Significant dates on policy changes or announcements in each region were sourced from news and country, regional, state, and local announcements. The COVID Tracking Project and 2019 Novel Coronavirus COVID-19 (2019-nCoV) Data Repository by Johns Hopkins CSSE informed the confirmed COVID-19 cases trajectory on the regional graphs.
About Fastly
Fastly helps people stay better connected with the things they love. Fastly’s edge cloud platform enables customers to create great digital experiences quickly, securely, and reliably by processing, serving, and securing our customers’ applications as close to their end-users as possible — at the edge of the internet. The platform is designed to take advantage of the modern internet, to be programmable, and to support agile software development. Fastly’s customers use our edge cloud platform to ensure concertgoers can buy tickets to the live events they love, travelers can book flights seamlessly and embark on their next great adventure, and sports fans can stream events in real time, across devices. They include many of the world’s most prominent companies, including Alaska Airlines, The New York Times, and Ticketmaster.
Forward Looking Statements
This press release contains “forward-looking” statements that are based on Fastly’s beliefs and assumptions and on information currently available to Fastly on the date of this press release. Forward-looking statements may involve known and unknown risks, uncertainties, and other factors that may cause its actual results, performance, or achievements to be materially different from those expressed or implied by the forward-looking statements. These statements include, but are not limited to, those regarding the internet’s ability to handle increased activity and the likelihood of future degradation of internet quality, the health or resiliency of the internet, the continued ability of website and streaming video sites to function, the correlation between internet quality and regional stay-at-home orders, and the continuation of any of the trends described above including increased activity in informational and entertainment verticals. Except as required by law, Fastly assumes no obligation to update these forward-looking statements publicly, or to update the reasons actual results could differ materially from those anticipated in the forward-looking statements, even if new information becomes available in the future. Important factors that could cause Fastly’s actual results to differ materially are detailed from time to time in the reports Fastly files with the Securities and Exchange Commission (SEC), including in its Annual Report on Form 10-K for the year ended December 31, 2019. Copies of reports filed with the SEC are posted on Fastly’s website and are available from Fastly without charge.
12020 baseline dates for each country/state: Italy - February 18; UK - February 27; Japan - February 18; France - February 26; Spain - March 1; California - March 1; New York and New Jersey - March 1; Michigan - March 1
View source version on businesswire.com: https://www.businesswire.com/news/home/20200408005584/en/
Contacts:
Elaine Greenberg
press@fastly.com
Investor Contact
Maria Lukens
ir@fastly.com
